quadVAR
Quadratic Vector Autoregression
Estimate quadratic vector autoregression models with the
strong hierarchy using the Regularization Algorithm under Marginality
Principle (RAMP) by Hao et al. (2018)
quadVAR

Estimate quadratic vector autoregression models with the strong hierarchy using the RAMP algorithm, compare the performance with linear models, and construct networks with partial derivatives.
Installation
You can install the development version of quadVAR from GitHub with:
# install.packages("devtools")
devtools::install_github("Sciurus365/quadVAR")
Example
library(quadVAR)
set.seed(1614)
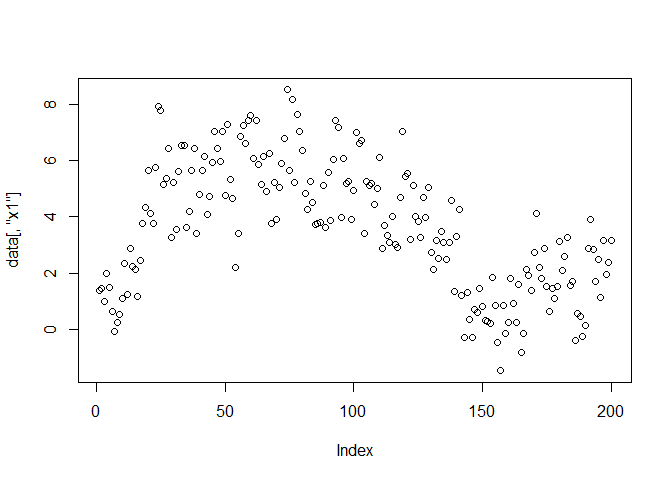
data <- sim_4_emo(time = 200, sd = 1)
plot(data[, "x1"])
qV1 <- quadVAR(data, vars = c("x1", "x2", "x3", "x4"))
summary(qV1)
#> # A tibble: 6 × 5
#>   Model        Sumdf SumIC DiffIC    Weight
#>   <chr>        <dbl> <dbl>  <dbl>     <dbl>
#> 1 NULL_model       0 3580. 1132.  1.96e-246
#> 2 AR               4 2775.  326.  1.83e- 71
#> 3 VAR             16 2544.   95.4 1.95e- 21
#> 4 VAR_full        16 2544.   95.4 1.95e- 21
#> 5 quadVAR         28 2449.    0   1.00e+  0
#> 6 quadVAR_full    56 2519.   70.1 5.95e- 16
coef(qV1)
#>  model effect estimate
#>     x1     x1   1.6273
#>     x1     x3   0.0329
#>     x1     x4  -0.0751
#>     x1  x1:x1  -0.1019
#>     x1  x1:x3  -0.1177
#>     x1  x1:x4  -0.1065
#>     x1  x3:x3  -0.0104
#>     x1  x4:x4   0.0157
#>     x2     x1   0.2520
#>     x2     x2   1.4055
#>     x2     x3   0.4096
#>     x2     x4   0.0446
#>     x2  x1:x3  -0.0760
#>     x2  x2:x2  -0.0863
#>     x2  x2:x3  -0.0822
#>     x2  x2:x4  -0.1158
#>     x2  x3:x3  -0.0565
#>     x3     x1  -0.1685
#>     x3     x2   0.1035
#>     x3     x3   1.6050
#>     x3  x1:x3  -0.0769
#>     x3  x2:x2   0.0018
#>     x3  x2:x3  -0.1377
#>     x3  x3:x3  -0.1004
#>     x4     x1   0.0675
#>     x4     x2  -0.1798
#>     x4     x4   0.8196
#>     x4  x1:x4  -0.1138
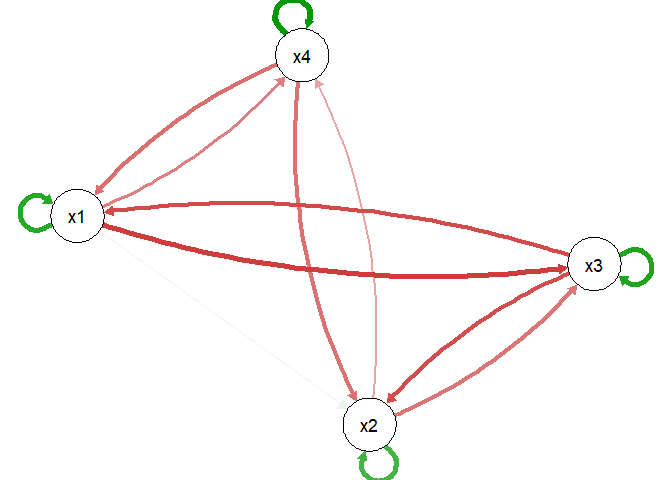
plot(qV1)
#> ℹ The quadVAR model, being nonlinear, generates a network meaningful only for
#>   specific variable values. If values are unspecified, the linearization/the
#>   plot defaults to 0 (i.e., the mean values of all variables if
#>   `value_standardized = TRUE`), but this is not a complete description of the
#>   model estimation and may not be meaningful in all cases.
#> This message is displayed once every 8 hours.
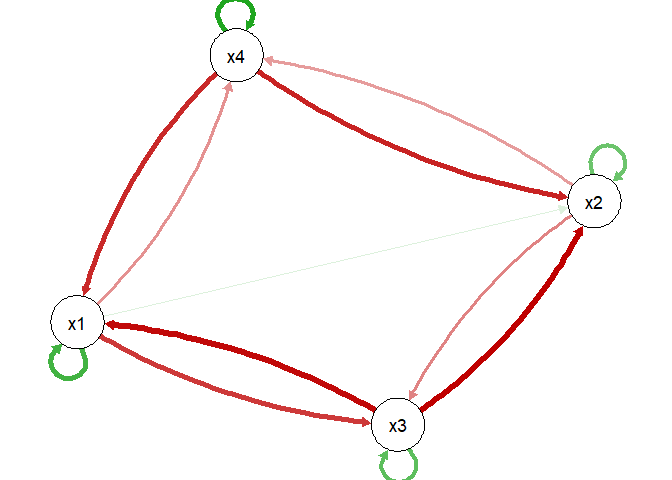
# Compare the estimation with the true model
plot(true_model_4_emo())
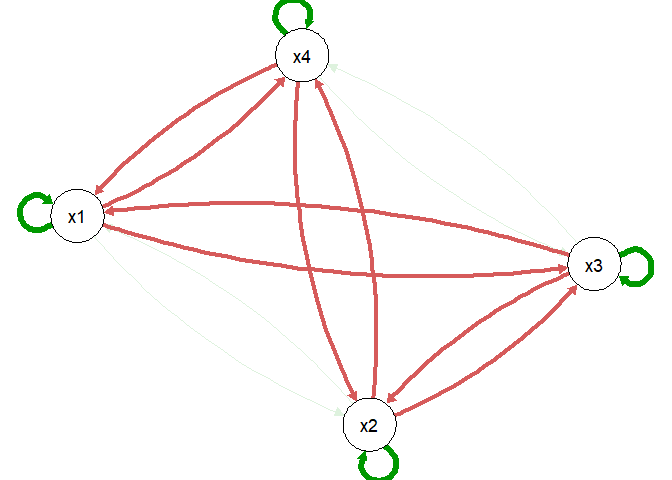
plot(qV1, value = rep(2.80, 4), value_standardized = FALSE, layout = plot(true_model_4_emo())$layout)