parttree
Visualize Simple 2-D Decision Tree Partitions
Visualize the partitions of simple decision trees, involving one or two predictors, on the scale of the original data. Provides an intuitive alternative to traditional tree diagrams, by visualizing how a decision tree divides the predictor space in a simple 2D plot alongside the original data. The 'parttree' package supports both classification and regression trees from 'rpart' and 'partykit', as well as trees produced by popular frontend systems like 'tidymodels' and 'mlr3'. Visualization methods are provided for both base R graphics and 'ggplot2'.
parttree 


Visualize simple 2-D decision tree partitions in R. The parttree package provides visualization methods for both base R graphics (via tinyplot) and ggplot2.
Installation
The stable version of parttree is available on CRAN.
install.packages("parttree")
Or, you can grab the latest development version from R-universe.
install.packages("parttree", repos = "https://grantmcdermott.r-universe.dev")
Quickstart
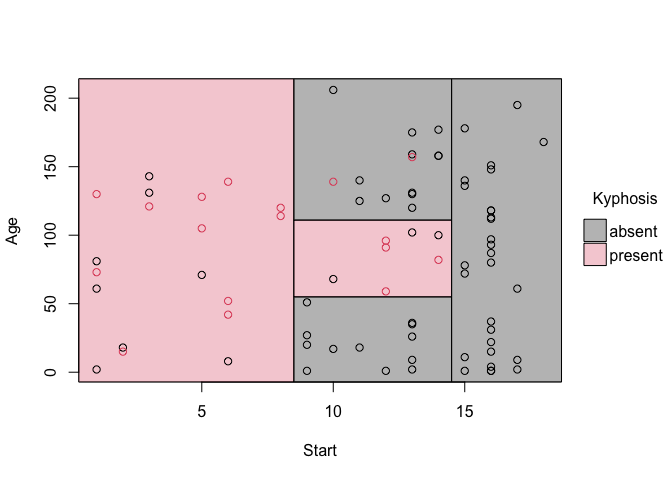
The parttree homepage includes an introductory vignette and detailed documentation. But here’s a quickstart example using the “kyphosis” dataset that comes bundled with the rpart package. In this case, we are interested in predicting kyphosis recovery after spinal surgery, as a function of 1) the number of topmost vertebra that were operated, and 2) patient age.
The key function is parttree(), which comes with its own plotting
method.
library(rpart)     # For the dataset and fitting decisions trees
library(parttree)  # This package

fit = rpart(Kyphosis ~ Start + Age, data = kyphosis)

# Grab the partitions and plot
fit_pt = parttree(fit)
plot(fit_pt)
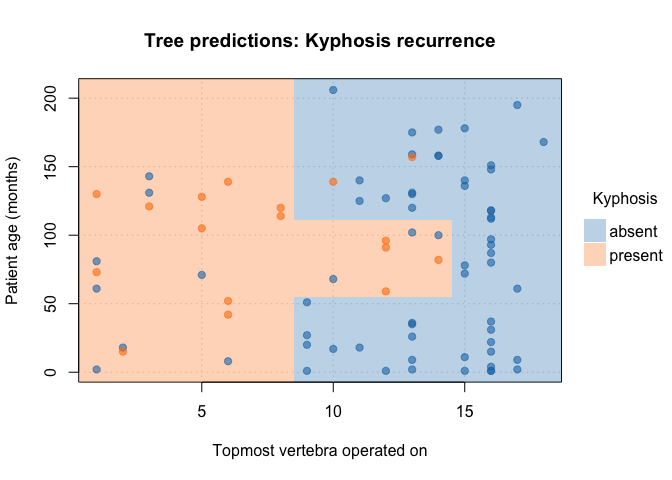
Customize your plots by passing additional arguments:
plot(
   fit_pt,
   border  = NA,                                     # no partition borders
   pch     = 19,                                     # filled points
   alpha   = 0.6,                                    # point transparency
   grid    = TRUE,                                   # background grid
   palette = "classic",                              # new colour palette
   xlab    = "Topmost vertebra operated on",         # custom x title
   ylab    = "Patient age (months)",                 # custom y title
   main    = "Tree predictions: Kyphosis recurrence" # custom title
)
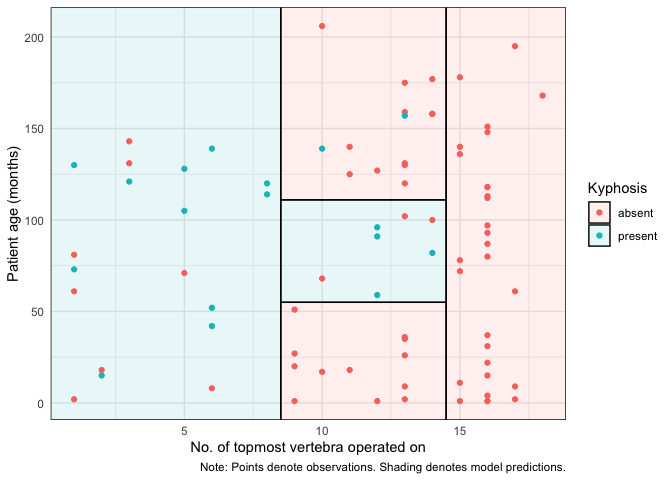
ggplot2
For ggplot2 users, we offer an equivalent workflow via the
geom_partree() visualization layer.
library(ggplot2) ## Should be loaded separately

ggplot(kyphosis, aes(x = Start, y = Age)) +
  geom_parttree(data = fit, alpha = 0.1, aes(fill = Kyphosis)) + # <-- key layer
  geom_point(aes(col = Kyphosis)) +
  labs(
    x = "No. of topmost vertebra operated on", y = "Patient age (months)",
    caption = "Note: Points denote observations. Shading denotes model predictions."
    ) +
  theme_minimal()