leafpop
Include Tables, Images and Graphs in Leaflet Pop-Ups
Creates 'HTML' strings to embed tables, images or graphs in pop-ups of interactive maps created with packages like 'leaflet' or 'mapview'. Handles local images located on the file system or via remote URL. Handles graphs created with 'lattice' or 'ggplot2' as well as interactive plots created with 'htmlwidgets'.
Include Tables, Images and Graphs in Leaflet Popups

leafpop creates HTML strings to embed tables, images or graphs in
popups of interactive maps created with packages ‘leaflet’ or ‘mapview’.
Handles local paths to images on the file system or remote urls. Handles
graphs created with ‘base’ graphics, ‘lattice’ or ‘ggplot2’ as well as
interactive plots created with ‘htmlwidgets’.
Installation
You can install the released version of leafpop from
CRAN with:
install.packages("leafpop")
Or the development version from GitHub:
# install.packages("devtools")
devtools::install_github("r-spatial/leafpop")
Examples
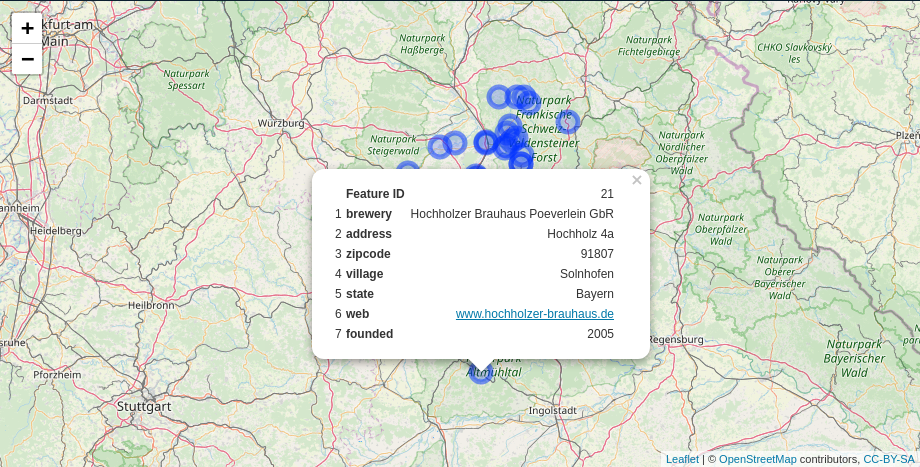
popupTable
library(leaflet)

leaflet() %>%
  addTiles() %>%
  addCircleMarkers(data = breweries91,
                   popup = popupTable(breweries91))
addPopupImages & popupImage
library(sf)
library(leaflet)

pnt = st_as_sf(data.frame(x = 174.764474, y = -36.877245),
                coords = c("x", "y"),
                crs = 4326)

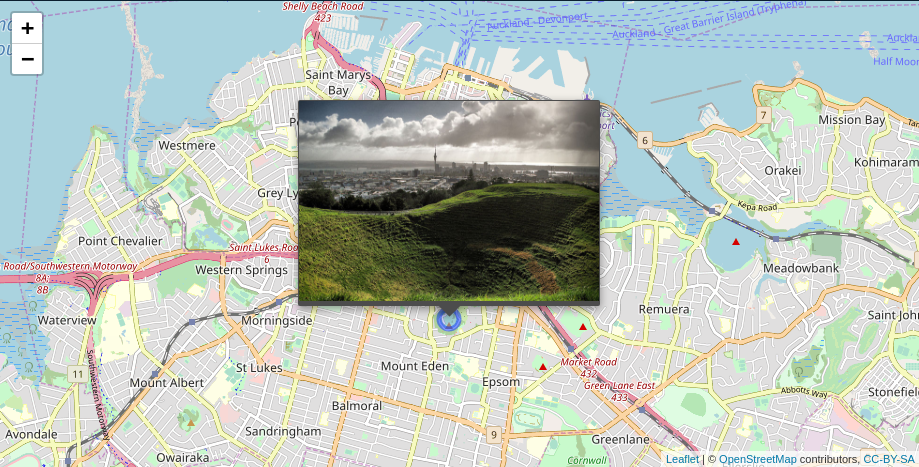
img = "http://bit.ly/1TVwRiR"

leaflet() %>%
  addTiles() %>%
  addCircleMarkers(data = pnt, group = "pnt") %>%
  addPopupImages(img, group = "pnt")
Alternatively you can bind the images directly in in the add* call,
however, this will not include the images when the map is saved using
mapshot or saveWidget. This options is basically available for
backward compatibility only.
leaflet() %>%
  addTiles() %>%
  addCircleMarkers(data = pnt, popup = popupImage(img, src = "remote"))
popupGraph
library(sf)
library(leaflet)
library(lattice)

pnt = st_as_sf(data.frame(x = 174.764474, y = -36.877245),
                coords = c("x", "y"),
                crs = 4326)

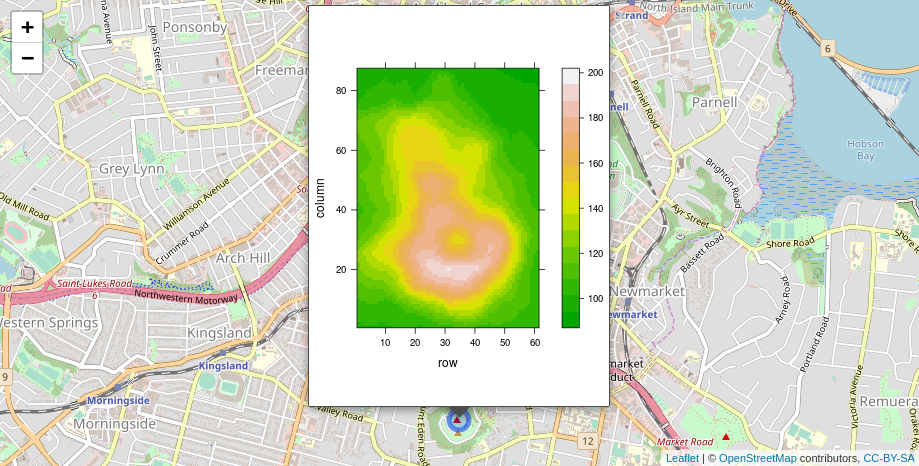
p2 = levelplot(t(volcano), col.regions = terrain.colors(100))

leaflet() %>%
  addTiles() %>%
  addCircleMarkers(data = pnt, group = "pnt") %>%
  addPopupGraphs(list(p2), group = "pnt", width = 300, height = 400)
Alternatively you can bind the graphs directly in in the add* call,
however, this will not include the graphs when the map is saved using
mapshot or saveWidget. This options is basically available for
backward compatibility only.
leaflet() %>%
  addTiles() %>%
  addCircleMarkers(data = pnt, popup = popupGraph(p2, width = 300, height = 400))
Further examples
See the mapview documentation for further examples.
Code of Conduct
Please note that the ‘leafpop’ project is released with a Contributor Code of Conduct. By participating in this project you agree to abide by its terms.