ggperiodic
Easy Plotting of Periodic Data with 'ggplot2'
Implements methods to plot periodic data in any arbitrary range on the fly.
ggperiodic 

ggperiodic is an attempt to solve the issue of plotting periodic data in ggplot2. It automatically augments your data to wrap it around to any arbitrary domain.
Installation
You can install the latest version from CRAN with
install.packages("ggperiodic")
Or you can install the development version from GitHub with:
# install.packages("devtools")
devtools::install_github("eliocamp/ggperiodic")
Example
Let’s create some artificial data with periodic domain
x <- seq(0, 360 - 10, by = 10)*pi/180
y <- seq(-90, 90, by = 10)*pi/180

Z <- expand.grid(x = x, y = y)
Z$z <- with(Z, 1.2*sin(x)*0.4*sin(y*2) -
               0.5*cos(2*x)*0.5*sin(3*y) +
               0.2*sin(4*x)*0.45*cos(2*x))

Z$x <- Z$x*180/pi
Z$y <- Z$y*180/pi
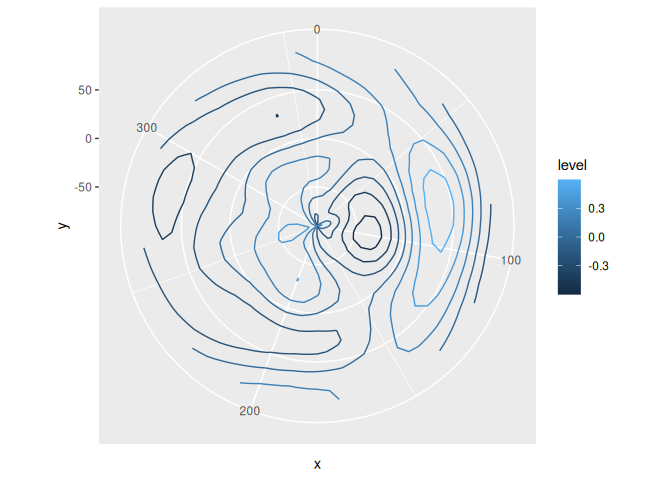
If you try to plot it, you’ll notice problems at the limits
library(ggplot2)
ggplot(Z, aes(x, y, z = z, color = ..level..)) +
  geom_contour() +
  coord_polar()
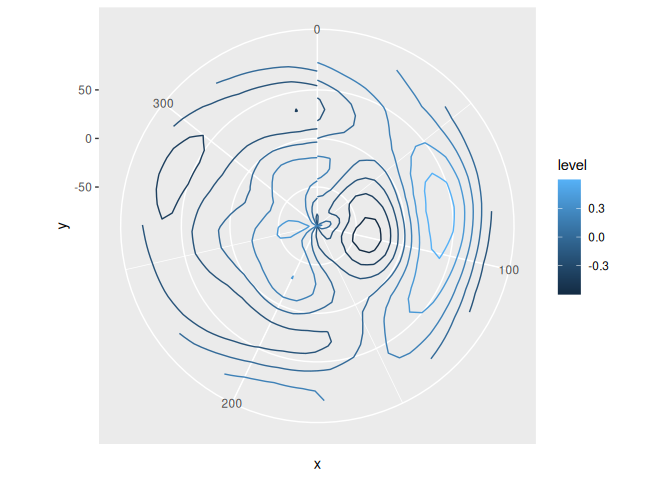
With ggperiodic you can define the periodic dimensions and ggplot2 does the rest.
library(ggperiodic)
#>
#> Attaching package: 'ggperiodic'
#> The following object is masked from 'package:stats':
#>
#>     filter
Z <- periodic(Z, x = c(0, 360))

ggplot(Z, aes(x, y, color = ..level..)) +
  geom_contour(aes(z = z)) +
  coord_polar()