designit
Blocking and Randomization for Experimental Design
Intelligently assign samples to batches in order to reduce batch effects.
Batch effects can have a significant impact on data analysis, especially
when the assignment of samples to batches coincides with the contrast
groups being studied. By defining a batch container and a scoring function
that reflects the contrasts, this package allows users to assign samples in
a way that minimizes the potential impact of batch effects on the
comparison of interest. Among other functionality, we provide an
implementation for OSAT score by Yan et al. (2012,
designit 


The goal of designit is to generate optimal sample allocations for experimental designs.
Installation
Install the released version of rlang from CRAN:
install.packages("designit")
You can install the development version from GitHub with:
# install.packages("devtools")
devtools::install_github("BEDApub/designit")
Usage
R in Pharma presentation

Batch container
The main class used is BatchContainer, which holds the dimensions for
sample allocation. After creating such a container, a list of samples
can be allocated in it using a given assignment function.
Creating a table with sample information
library(tidyverse)
library(designit)

data("longitudinal_subject_samples")

# we use a subset of longitudinal_subject_samples data
subject_data <- longitudinal_subject_samples %>%
  filter(Group %in% 1:5, Week %in% c(1,4)) %>%
  select(SampleID, SubjectID, Group, Sex, Week) %>%
  # with two observations per patient
  group_by(SubjectID) %>%
  filter(n() == 2) %>%
  ungroup() %>%
  select(SubjectID, Group, Sex) %>%
  distinct()

head(subject_data)
#> # A tibble: 6 × 3
#>   SubjectID Group Sex
#>   <chr>     <chr> <chr>
#> 1 P01       1     F
#> 2 P02       1     M
#> 3 P03       1     M
#> 4 P04       1     F
#> 5 P19       1     M
#> 6 P20       1     F
Creating a BatchContainer and assigning samples
# a batch container with 3 batches and 11 locations per batch
bc <- BatchContainer$new(
  dimensions = list("batch" = 3, "location" = 11),
)

# assign samples randomly
set.seed(17)
bc <- assign_random(bc, subject_data)

bc$get_samples() %>%
  ggplot() +
  aes(x = batch, fill = Group) +
  geom_bar()
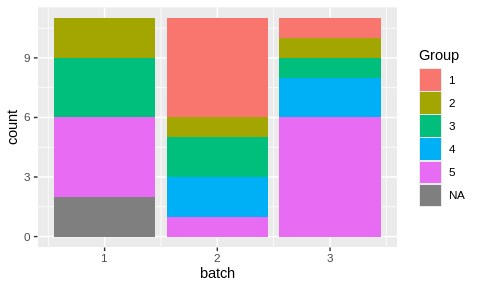
Random assignmet of samples to batches produced an uneven distribution.
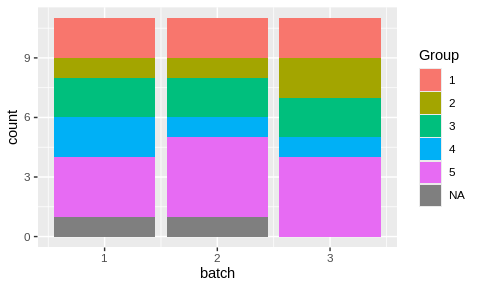
Optimizing the assignemnt
# set scoring functions
scoring_f <- list(
  # first priority, groups are evenly distributed
  group = osat_score_generator(batch_vars = "batch",
                               feature_vars = "Group"),
  # second priority, sexes are evenly distributed
  sex = osat_score_generator(batch_vars = "batch",
                             feature_vars = "Sex")
)

bc <- optimize_design(
  bc, scoring = scoring_f, max_iter = 150, quiet = TRUE
)

bc$get_samples() %>%
  ggplot() +
  aes(x = batch, fill = Group) +
  geom_bar()
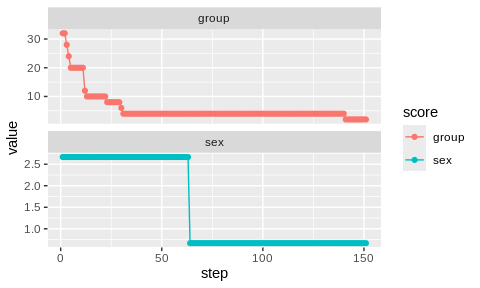
# show optimization trace
bc$plot_trace()
Examples
See vignettes vignette("basic_examples").
Acknowledgement
The logo is inspired by DALL-E 2 and pipette icon by gsagri04.