animbook
Visualizing Changes in Performance Measures and Demographic Affiliations using Animation
Create an interactive visualization to be used for communication purposes. Providing the function for preparing, plotting, and animating the data. Krisanat Anukarnsakulchularp (2023) < https://github.com/KrisanatA/animbook-journal>.
animbook 
“animbook” is a package to help the user visualize the changes in performance measures and demographic affiliations using animation. It is a package to help prepare, plot, and animate the data.
Installation
You can install the development version of animbook from GitHub with:
install.packages("animbook")
Examples
Accounting database: osiris
library(animbook)
library(dplyr)
data <- osiris |>
  filter(country %in% c("US", "JP"))

label <- c("Top 25%", "25-50", "50-75", "75-100", "Not listed")

accounting <- anim_prep(data,
                      id = ID,
                      values = sales,
                      time = year,
                      label = label,
                      ncat = 4,
                      group = country)

p <- wallaby_plot(accounting,
                  group_palette = RColorBrewer::brewer.pal(9, "Set1"),
                  shade_palette = c("#777777", "#777777", "#777777",
                                    "#777777", "#777777"),
                  subset = "bottom",
                  relation = "many_one",
                  height = 1,
                  size = 2,
                  width = 100,
                  total_point = 1000)
#> You can now use the animbook::anim_animate() function to
#>           transform it into an animated object

p2 <- anim_animate(p)
#> You can now pass it to gganimate::animate().
#>                    The recommended setting is nframes = 139

gganimate::animate(p2)
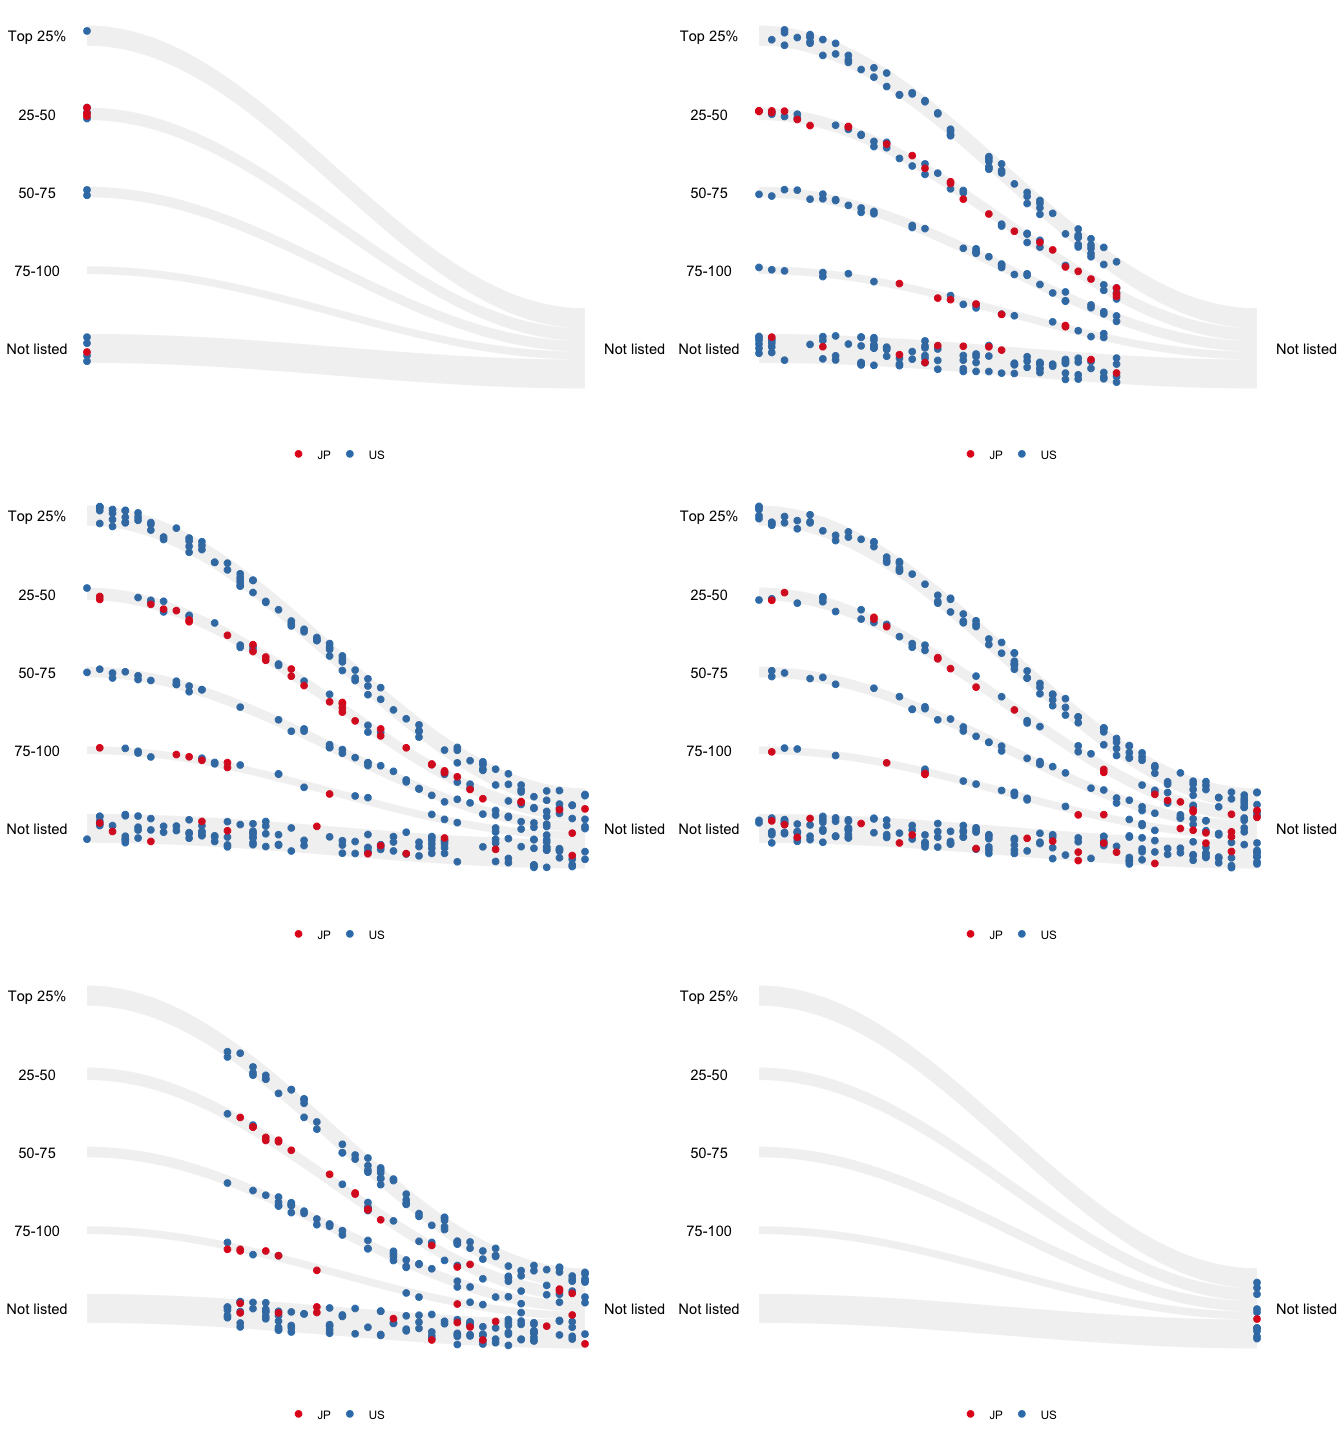
All the companies in the Top 25% were US companies. Any Japanese companies in the Top 25% in 2006 did not exit the market (Not listed). It is worth noting that in 2006, there were no Japanese companies in the Top 25%. It is also interesting that a large proportion of companies in the Top 25% are being de-listed, and the lower the quartile, the less likely the companies are to exit the market.
Voter behavior
library(animbook)

voter <- anim_prep_cat(data = aeles,
                       id = id,
                       values = party,
                       time = year,
                       group = gender,
                       order = NULL)

p_voter <- wallaby_plot(data = voter,
                  group_palette = c("pink", "blue", "red"),
                  shade_palette = c("#777777", "#777777", "#777777",
                                    "#777777", "#777777", "#777777"),
                  time_dependent = FALSE,
                  rendering = "gganimate",
                  subset = "top",
                  relation = "one_many",
                  height = 1,
                  size = 2.5,
                  width = 100,
                  total_point = 1000)
#> You can now use the animbook::anim_animate() function to
#>           transform it into an animated object

p2_voter <- anim_animate(p_voter)
#> You can now pass it to gganimate::animate().
#>                    The recommended setting is nframes = 139

gganimate::animate(p2_voter)
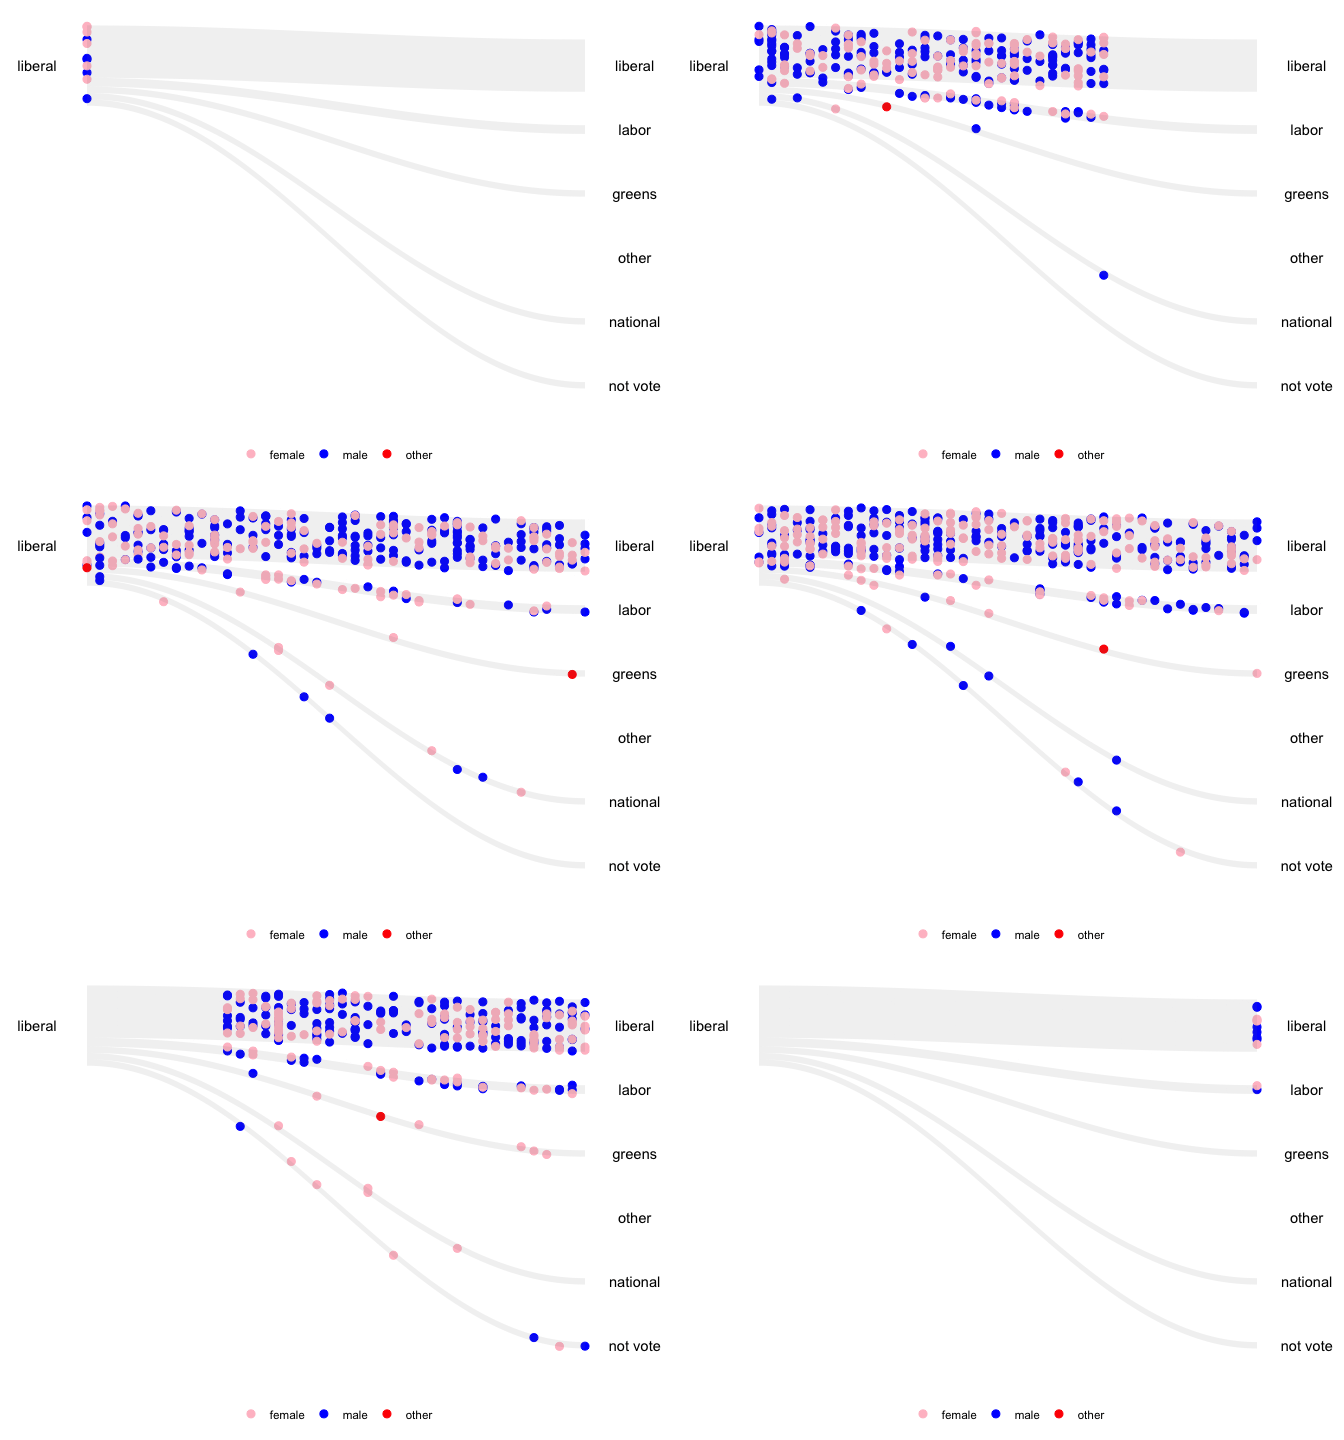
It reveals a pattern where individuals who identified their gender as ‘others’ have shifted their voting preference from the Liberal Party, the leading party in 2006, to the Greens Party.