activatr
Utilities for Parsing and Plotting Activities
This contains helpful functions for parsing, managing, plotting, and visualizing activities, most often from GPX (GPS Exchange Format) files recorded by GPS devices. It allows easy parsing of the source files into standard R data formats, along with functions to compute derived data for the activity, and to plot the activity in a variety of ways.
activatr 


activatr (pronounced like the word “activator”) is a library for
parsing GPX files into a standard format, and then manipulating and
visualizing those files.
Installation
You can install the released version of activatr from CRAN with:
install.packages("activatr")
And the development version from GitHub with:
# install.packages("devtools")
devtools::install_github("dschafer/activatr")
Usage
library(activatr)
Parsing
activatr contains function to parse, analyze, and display GPX
activities. The most basic thing you can do is parse a GPX file into a
tibble:
# Get the running_example.gpx file included with this package.
filename <- system.file(
  "extdata",
  "running_example.gpx.gz",
  package = "activatr"
)

df <- parse_gpx(filename)
| lat | lon | ele | time |
|---|---|---|---|
| 37.80405 | -122.4267 | 17.0 | 2018-11-03 14:24:45 |
| 37.80406 | -122.4267 | 16.8 | 2018-11-03 14:24:46 |
| 37.80408 | -122.4266 | 17.0 | 2018-11-03 14:24:48 |
| 37.80409 | -122.4266 | 17.0 | 2018-11-03 14:24:49 |
| 37.80409 | -122.4265 | 17.2 | 2018-11-03 14:24:50 |
Visualizing
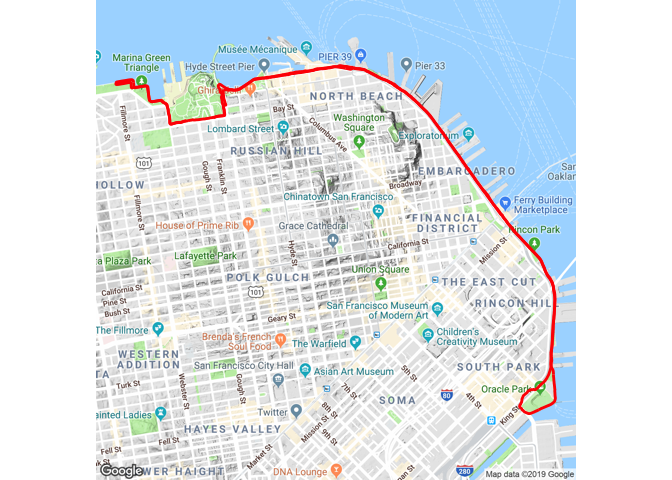
Once we have that data, we can visualize it atop a map:
library(ggmap)
library(ggplot2)
ggmap::ggmap(get_ggmap_from_df(df)) +
  theme_void() +
  geom_path(aes(x = lon, y = lat), linewidth = 1, data = df, color = "red")
For more details on how to use the package, check out
vignette("activatr").