vaxineR
Vaccine Coverage and Outbreak Risk Analysis
Provides tools to analyze vaccine coverage data and simulate potential disease outbreak scenarios. It allows users to calculate key epidemiological metrics such as the effective reproduction number (Re), outbreak probabilities, and expected infection counts based on county-level vaccination rates, disease characteristics, and vaccine effectiveness. The package includes historical kindergarten vaccination data for Florida counties and offers functions for generating summary tables, visualizations, and exporting the underlying plot data.
vaxineR 


vaxineR is an R package for analyzing kindergarten vaccine coverage
data and modeling potential infectious disease outbreak risks. It
provides functions to calculate key epidemiological metrics, generate
summary tables, and create insightful visualizations based on historical
Florida county data.
Key Features
- Calculate Effective Reproduction Number (Re), outbreak probabilities, and expected infections.
- Model risk for different diseases (Measles, Pertussis, Chickenpox) and scenarios.
- Includes cleaned, tidy historical vaccination data for Florida counties (2016-2024).
- Generate publication-ready plots for risk curves, outbreak probabilities, and historical trends.
- Export the data underlying any plot to CSV or Excel for further analysis.
Installation
You can install the development version of vaxineR from GitHub with:
# install.packages("devtools")
devtools::install_github("YOUR-GITHUB-USERNAME/vaxineR")
Example Usage
library(vaxineR)
library(dplyr)
#>
#> Attaching package: 'dplyr'
#> The following objects are masked from 'package:stats':
#>
#>     filter, lag
#> The following objects are masked from 'package:base':
#>
#>     intersect, setdiff, setequal, union
1. Basic Calculations
Calculate the expected number of measles infections in a school of 100 students where vaccination coverage is 88%.
calc_expected_infections(
  vc = 0.88,
  VE = 0.97,
  disease = "Measles",
  kindergarten_size = 100
)
#> [1] 13
2. Generate a Risk Summary Table
Quickly assess the situation for a given year. The table shows risk scenarios for the statewide average and counties at different coverage quantiles.
summary_infection_risk(yr = 2024, disease = "Measles", VE = 0.97)
#> # A tibble: 6 × 7
#> Scenario `Vaccination Coverage` `Effective R (Re)` Susceptible (N = 200…¹
#> <chr> <chr> <dbl> <dbl>
#> 1 Statewide Av… 89.8% 1.93 26
#> 2 Minimum 83.4% 2.87 39
#> 3 25th Percent… 88.9% 2.06 28
#> 4 Median 91.4% 1.7 23
#> 5 75th Percent… 93.0% 1.48 20
#> 6 Maximum 96.6% 0.94 13
#> # ℹ abbreviated name: ¹`Susceptible (N = 200)`
#> # ℹ 3 more variables: `Expected Infections` <dbl>,
#> # `Prob >=1 Secondary Case` <chr>, `Prob Major Outbreak` <chr>
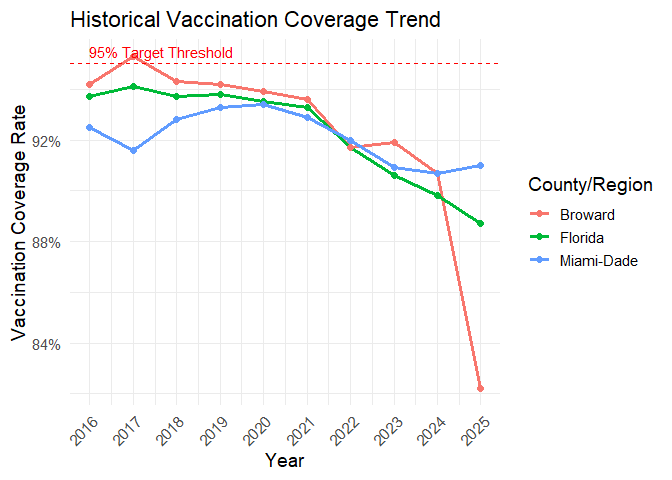
3. Visualize Historical Trends
Plot the vaccination coverage history for a few key counties.
plot_coverage_history(county_name = c("Florida", "Miami-Dade", "Broward"))
4. Plot a Risk Curve and Save the Data
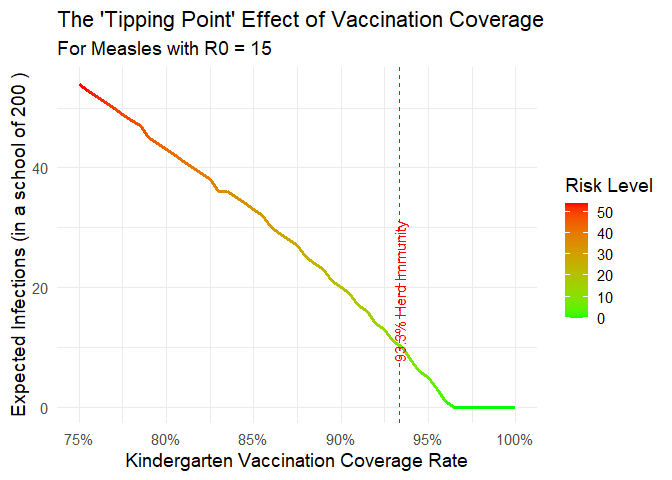
Visualize the non-linear “tipping point” of outbreak risk. We will also save the underlying data to an Excel file, which will contain both the data and a metadata sheet describing it.
plot_risk_curve(
  disease = "Measles",
  VE = 0.97,
  kindergarten_size = 200,
  save_data_to = "measles_risk_curve_data.xlsx"
)
#> Plot data and metadata saved to 'measles_risk_curve_data.xlsx'
The generated file measles_risk_curve_data.xlsx will now be in your
working directory.
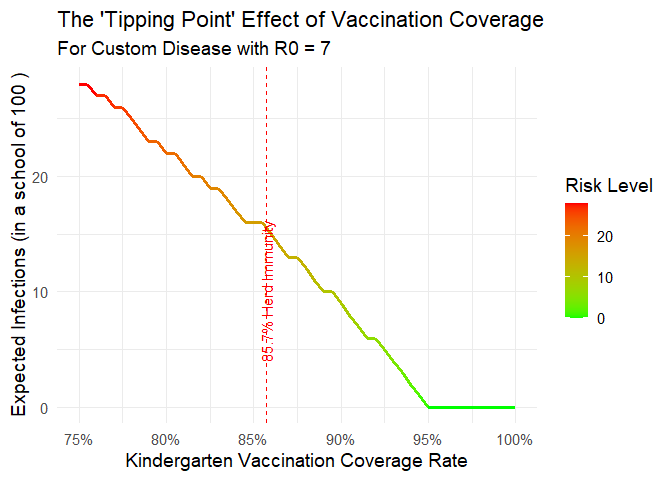
5. Modeling a Custom Disease
You can model any hypothetical disease by setting disease = “Custom” and providing a value for r0_custom.
plot_risk_curve(
  disease = "Custom",
  VE = 0.90,
  r0_custom = 7,
  kindergarten_size = 100
)