tidyMC
Monte Carlo Simulations Made Easy and Tidy
Framework to run Monte Carlo simulations over a parameter grid. Allows to parallelize the simulations. Generates plots and 'LaTeX' tables summarizing the results from the simulation.
tidyMC

Monte Carlo Simulations aim to study the properties of statistical
inference techniques. At its core, a Monte Carlo Simulation works
through the application of the techniques to repeatedly drawn samples
from a pre-specified data generating process. The tidyMC package aims
to cover and simplify the whole workflow of running a Monte Carlo
simulation in either an academic or professional setting. Thus, tidyMC
aims to provide functions for the following tasks:
- Running a Monte Carlo Simulation for a user defined function over a
parameter grid using
future_mc() - Summarizing the results by (optionally) user defined summary functions
using
summary.mc() - Creating plots of the Monte Carlo Simulation results, which can be
modified by the user using
plot.mc()andplot.summary.mc() - Creating a
LaTeXtable summarizing the results of the Monte Carlo Simulation usingtidy_mc_latex()
Installing tidyMC
Install from CRAN
install.packages("tidyMC")
or download the development version from GitHub as follows:
# install.packages("devtools")
devtools::install_github("stefanlinner/tidyMC", build_vignettes = TRUE)
Afterwards you can load the package:
library(tidyMC)
Example
library(magrittr)
library(ggplot2)
library(kableExtra)
This is a basic example which shows you how to solve a common problem. For a more elaborate example please see the vignette:
browseVignettes(package = "tidyMC")
#> starte den http Server für die Hilfe fertig
Run your first Monte Carlo Simulation using your own parameter grid:
test_func <- function(param = 0.1, n = 100, x1 = 1, x2 = 2){

  data <- rnorm(n, mean = param) + x1 + x2
  stat <- mean(data)
  stat_2 <- var(data)

  if (x2 == 5){
    stop("x2 can't be 5!")
  }

  return(list(mean = stat, var = stat_2))
}

param_list <- list(param = seq(from = 0, to = 1, by = 0.5),
                   x1 = 1:2)

set.seed(101)

test_mc <- future_mc(
  fun = test_func,
  repetitions = 1000,
  param_list = param_list,
  n = 10,
  x2 = 2,
  check = TRUE
)
#> Running single test-iteration for each parameter combination...
#>
#>  Test-run successfull: No errors occurred!
#> Running whole simulation: Overall 6 parameter combinations are simulated ...
#>
#>  Simulation was successfull!
#>  Running time: 00:00:06.505337

test_mc
#> Monte Carlo simulation results for the specified function:
#>
#>  function (param = 0.1, n = 100, x1 = 1, x2 = 2)
#> {
#>     data <- rnorm(n, mean = param) + x1 + x2
#>     stat <- mean(data)
#>     stat_2 <- var(data)
#>     if (x2 == 5) {
#>         stop("x2 can't be 5!")
#>     }
#>     return(list(mean = stat, var = stat_2))
#> }
#>
#>  The following 6 parameter combinations:
#> # A tibble: 6 × 2
#>   param    x1
#>   <dbl> <int>
#> 1   0       1
#> 2   0.5     1
#> 3   1       1
#> 4   0       2
#> 5   0.5     2
#> 6   1       2
#> are each simulated 1000 times.
#>
#>  The Running time was: 00:00:06.505337
#>
#>  Parallel: TRUE
#>
#>  The following parallelisation plan was used:
#> $strategy
#> multisession:
#> - args: function (..., workers = availableCores(), lazy = FALSE, rscript_libs = .libPaths(), envir = parent.frame())
#> - tweaked: FALSE
#> - call: NULL
#>
#>
#>  Seed: TRUE
Summarize your results:
sum_res <- summary(test_mc)
sum_res
#> Results for the output mean:
#>    param=0, x1=1: 3.015575
#>    param=0, x1=2: 4.003162
#>    param=0.5, x1=1: 3.49393
#>    param=0.5, x1=2: 4.480855
#>    param=1, x1=1: 3.985815
#>    param=1, x1=2: 4.994084
#>
#>
#> Results for the output var:
#>    param=0, x1=1: 0.9968712
#>    param=0, x1=2: 1.026523
#>    param=0.5, x1=1: 0.9933278
#>    param=0.5, x1=2: 0.9997529
#>    param=1, x1=1: 0.9979682
#>    param=1, x1=2: 1.005633
#>
#>
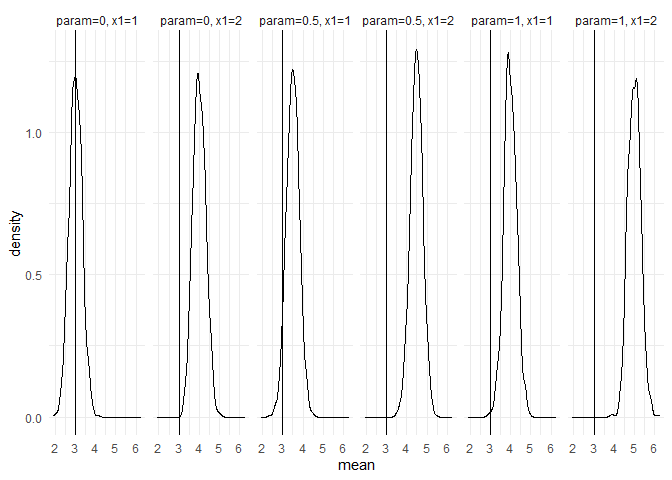
Plot your results / summarized results:
returned_plot1 <- plot(test_mc, plot = FALSE)

returned_plot1$mean +
 ggplot2::theme_minimal() +
 ggplot2::geom_vline(xintercept = 3)
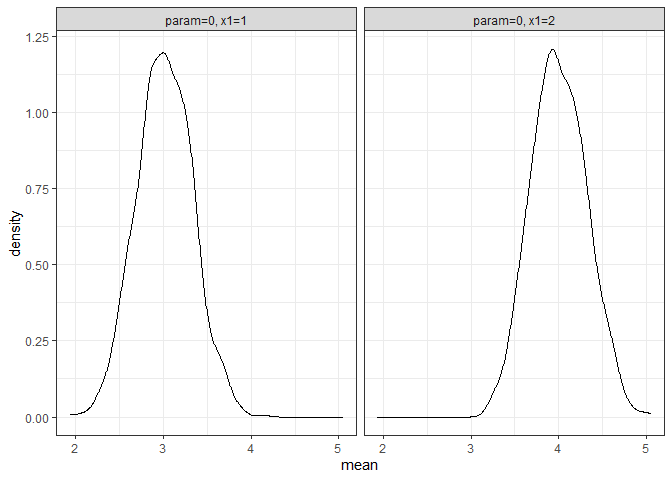
returned_plot2 <- plot(test_mc, which_setup = test_mc$nice_names[1:2], plot = FALSE)
returned_plot2$mean
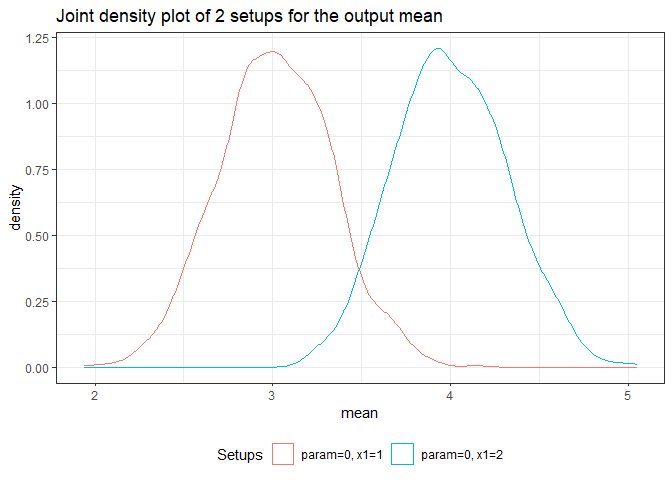
returned_plot3 <- plot(test_mc, join = test_mc$nice_names[1:2], plot = FALSE)
returned_plot3$mean
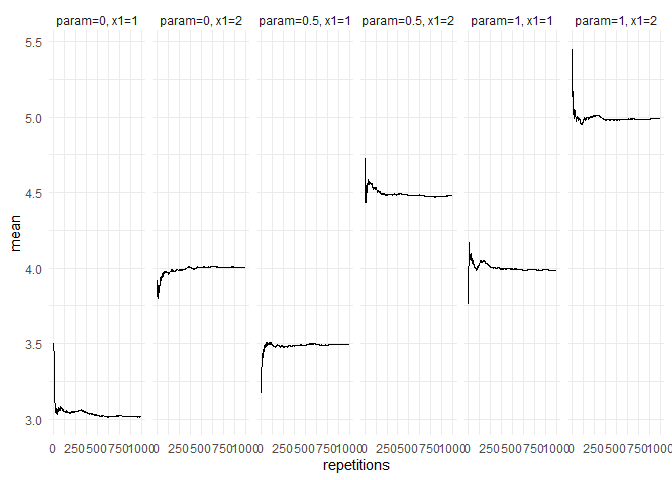
returned_plot1 <- plot(summary(test_mc), plot = FALSE)

returned_plot1$mean +
  ggplot2::theme_minimal()
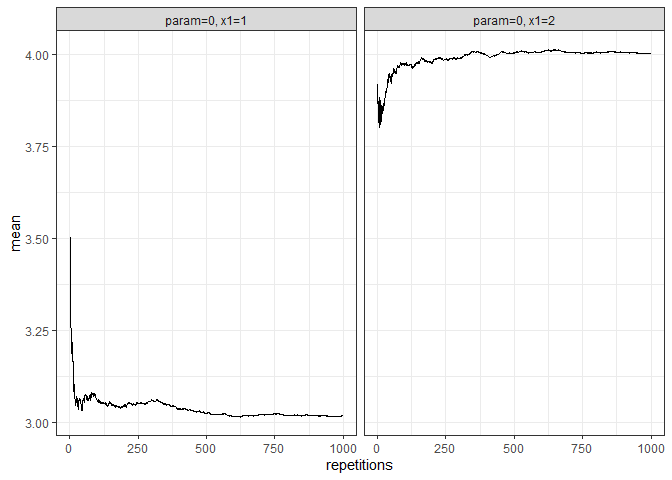
returned_plot2 <- plot(summary(test_mc), which_setup = test_mc$nice_names[1:2], plot = FALSE)
 returned_plot2$mean
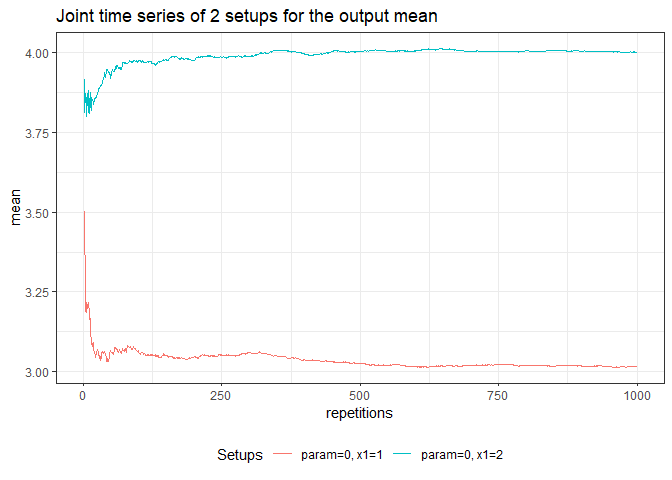
returned_plot3 <- plot(summary(test_mc), join = test_mc$nice_names[1:2], plot = FALSE)
returned_plot3$mean
Show your results in a LaTeX table:
tidy_mc_latex(summary(test_mc)) %>%
  print()
#> \begin{table}
#>
#> \caption{\label{tab:unnamed-chunk-10}Monte Carlo simulations results}
#> \centering
#> \begin{tabular}[t]{cccc}
#> \toprule
#> param & x1 & mean & var\\
#> \midrule
#> 0.0 & 1 & 3.016 & 0.997\\
#> 0.0 & 2 & 4.003 & 1.027\\
#> 0.5 & 1 & 3.494 & 0.993\\
#> 0.5 & 2 & 4.481 & 1.000\\
#> 1.0 & 1 & 3.986 & 0.998\\
#> \addlinespace
#> 1.0 & 2 & 4.994 & 1.006\\
#> \bottomrule
#> \multicolumn{4}{l}{\textsuperscript{} Total repetitions = 1000,}\\
#> \multicolumn{4}{l}{total parameter combinations}\\
#> \multicolumn{4}{l}{= 6}\\
#> \end{tabular}
#> \end{table}

tidy_mc_latex(
    summary(test_mc),
    repetitions_set = c(10,1000),
    which_out = "mean",
    kable_options = list(caption = "Mean MCS results")
) %>%
  print()
#> \begin{table}
#>
#> \caption{\label{tab:unnamed-chunk-10}Mean MCS results}
#> \centering
#> \begin{tabular}[t]{ccc}
#> \toprule
#> param & x1 & mean\\
#> \midrule
#> \addlinespace[0.3em]
#> \multicolumn{3}{l}{\textbf{N = 10}}\\
#> \hspace{1em}0.0 & 1 & 3.193\\
#> \hspace{1em}0.0 & 2 & 3.810\\
#> \hspace{1em}0.5 & 1 & 3.434\\
#> \hspace{1em}0.5 & 2 & 4.550\\
#> \hspace{1em}1.0 & 1 & 4.156\\
#> \hspace{1em}1.0 & 2 & 5.030\\
#> \addlinespace[0.3em]
#> \multicolumn{3}{l}{\textbf{N = 1000}}\\
#> \hspace{1em}0.0 & 1 & 3.016\\
#> \hspace{1em}0.0 & 2 & 4.003\\
#> \hspace{1em}0.5 & 1 & 3.494\\
#> \hspace{1em}0.5 & 2 & 4.481\\
#> \hspace{1em}1.0 & 1 & 3.986\\
#> \hspace{1em}1.0 & 2 & 4.994\\
#> \bottomrule
#> \multicolumn{3}{l}{\textsuperscript{} Total repetitions =}\\
#> \multicolumn{3}{l}{1000, total}\\
#> \multicolumn{3}{l}{parameter}\\
#> \multicolumn{3}{l}{combinations = 6}\\
#> \end{tabular}
#> \end{table}