statsapps
Interactive 'Shiny' Apps for Building Statistical Intuition
Provides interactive 'Shiny' applications for building intuition in statistics and data science. The apps run locally and use visualization, simulation, and repeated sampling to illustrate topics such as probability distributions, permutation tests, analysis of variance, linear regression, and sums of squares.
statsapps 


The statsapps R package features interactive Shiny apps to help you
learn concepts from data science & statistics.
The apps run locally and use visualization, simulation, and repeated sampling to illustrate topics such as probability distributions, permutation tests, analysis of variance, linear regression, and sums of squares.
For more see the statsapps package website.
Installation
Install the current release from CRAN:
install.packages("statsapps")
To get a bug fix or to use a feature from the development version, you
can instead install the development version of statsapps from this
GitHub repo with:
# install.packages("pak")
pak::pak("vbaliga/statsapps")
Available apps
run_distributions_app()run_sums_squares_app()run_anova_app()run_linear_reg_app()run_permutation_app()run_power_precision_app()
The apps open in your default web browser. Set launch.browser = FALSE
to disable this behavior.
Example
All apps can be started via functions from statsapps. Each app can be
started using a function that begins with run_. For example, use
run_permutation_app() to start the Shiny app for the Permutation Test.
This will open a new window in your default web browser with the Shiny
app.
library(statsapps)
run_permutation_app()
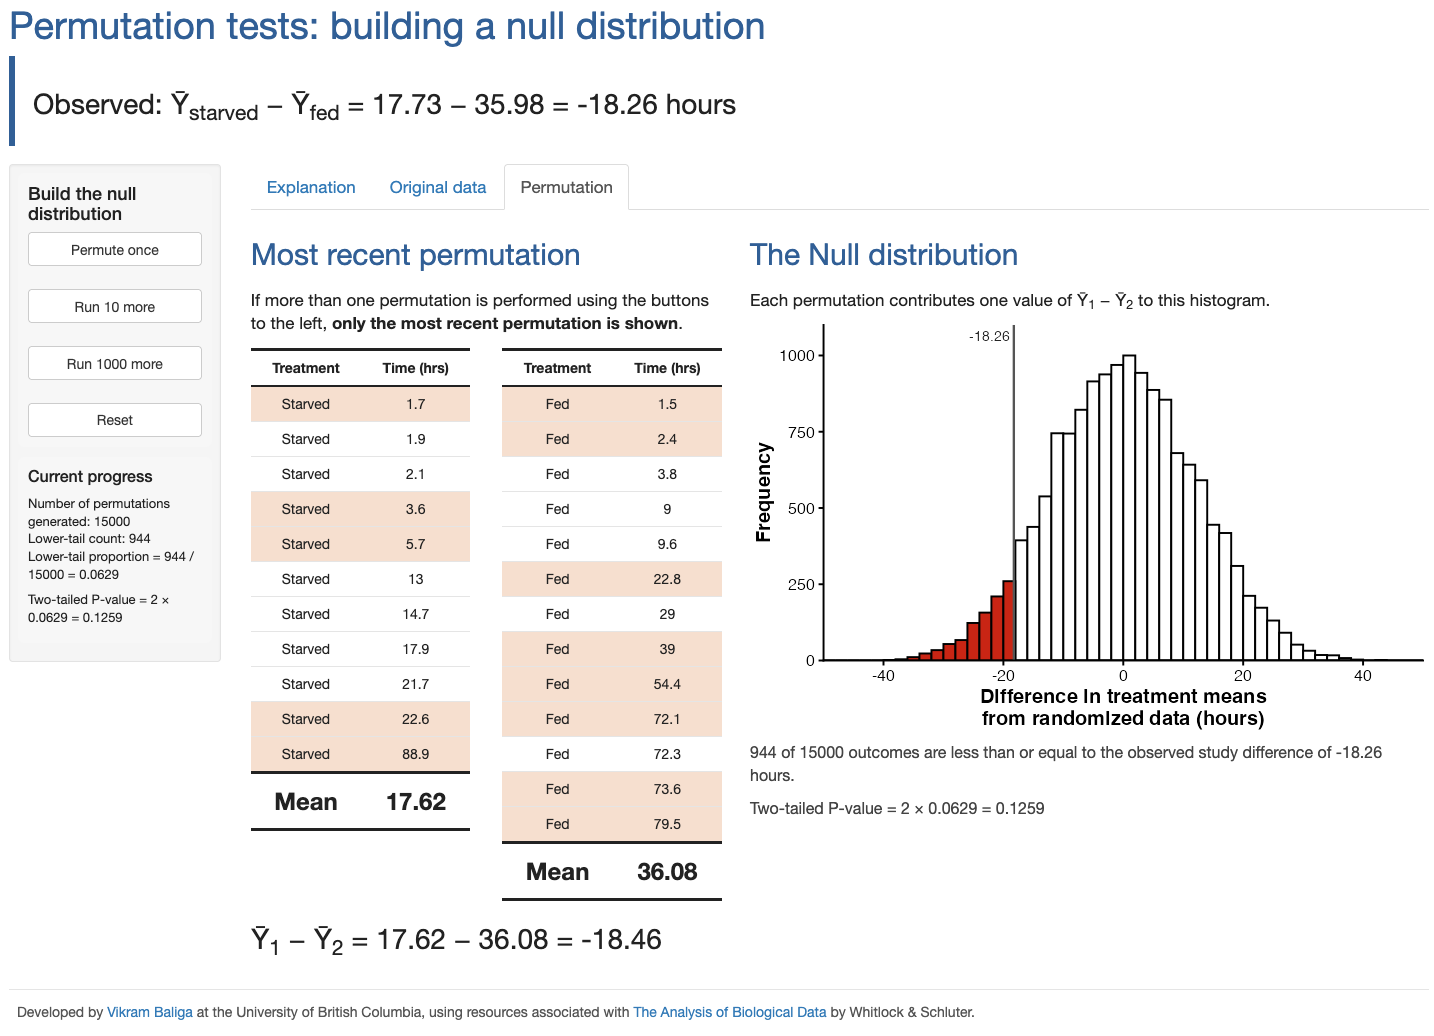
The example we showcase here is the Permutation Test app, demonstrates
how repeated random reassignment of observations can be used to build a
null distribution for a two-sample permutation test. As with all
statsapps, this app is interactive and allows you to see the results
of individual permutations, and how the result of each permutation
incrementally builds the null distribution.
There are several tabs within the main window of the app. The first two tabs provide an explanation and the original data. The third tab shows the results of performing permutations. The buttons in the left sidebar allow you to perform permutations and visualize the outcome of the most recent permutation.
Contributing and/or raising Issues
Feedback on bugs, improvements, and/or feature requests are all welcome. Please see the Issues section on GitHub to make a bug fix request or feature request.
Citation
To cite statsapps in publications, use:
citation("statsapps")
#> To cite package 'statsapps' in publications use:
#>
#>   Baliga VB (2026). _statsapps: Interactive 'Shiny' Apps for Building
#>   Statistical Intuition_. R package version 0.2.0,
#>   <https://github.com/vbaliga/statsapps>.
#>
#> A BibTeX entry for LaTeX users is
#>
#>   @Manual{,
#>     title = {statsapps: Interactive 'Shiny' Apps for Building Statistical Intuition},
#>     author = {Vikram B. Baliga},
#>     year = {2026},
#>     note = {R package version 0.2.0},
#>     url = {https://github.com/vbaliga/statsapps},
#>   }
The CRAN package DOI is 10.32614/CRAN.package.statsapps.
License
See LICENSE file (MIT)
🐢