shinyMolBio
Molecular Biology Visualization Tools for 'Shiny' Apps
Interactive visualization of 'RDML' files via 'shiny' apps. Package provides (1) PCR plate interface with ability to select individual tubes and (2) amplification/melting plots with fast hiding and highlighting individual curves.

shinyMolBio
Molecular biology visualization tools for Shiny apps
Manual
The manual is available online
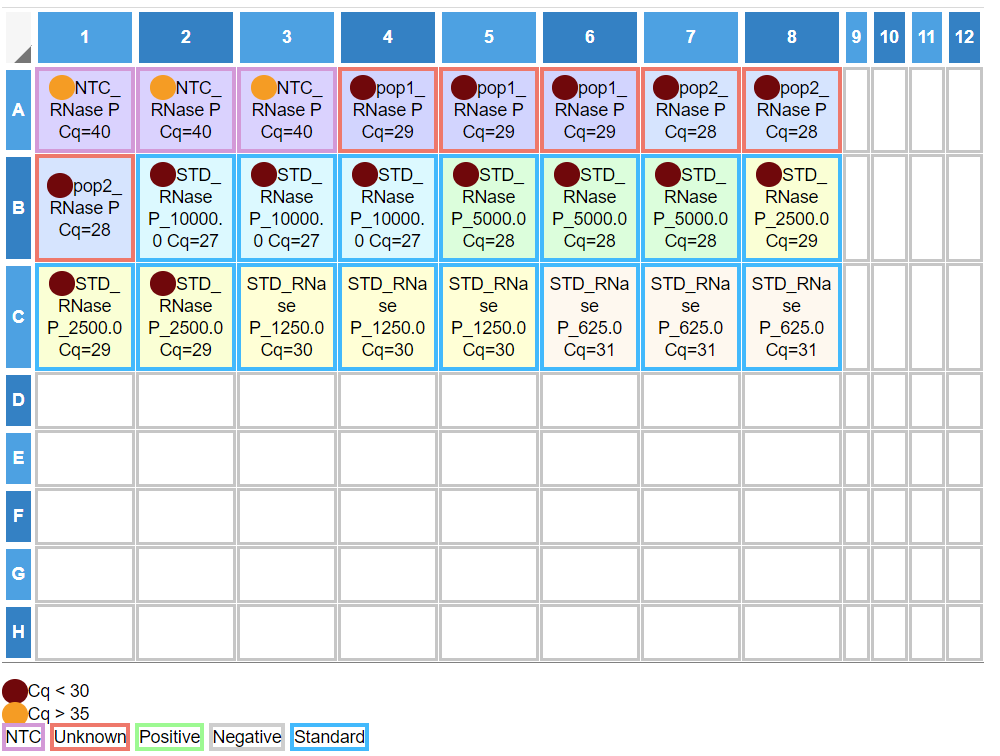
pcrPlateInput
Create an input control for representing PCR plate and dynamically selecting wells inside it.
renderAmpCurves
Create a plot with the real-time PCR amplification curves.
