sameplot
Consistent Plot Rendering and Saving Across Interactive Sessions and Reports
Renders plots to a temporary image using the ragg graphics device and returns knitr::include_graphics() output. Optionally saves the image to a specified path. This helps ensure consistent appearance across interactive sessions, saved files, and knitted documents. For more details see Pedersen and Shemanarev (2025)
sameplot

Render plots consistently across interactive R Markdown sessions, saved
files, and knitr output by drawing to a ragg device and displaying the
resulting image via knitr::include_graphics().
Why?
RStudio’s R Markdown inline plots, saved figures, and knitted documents
can differ due to different rendering engines and sizing settings.
sameplot() standardizes output by always rendering the plot to an
image first and then displaying that image in the correct size.
Installation
You can install the development version from GitHub:
install.packages("pak")
pak::pak("TomNaber/sameplot")
Alternatively (remotes):
install.packages("remotes")
remotes::install_github("TomNaber/sameplot")
Usage
library(sameplot)

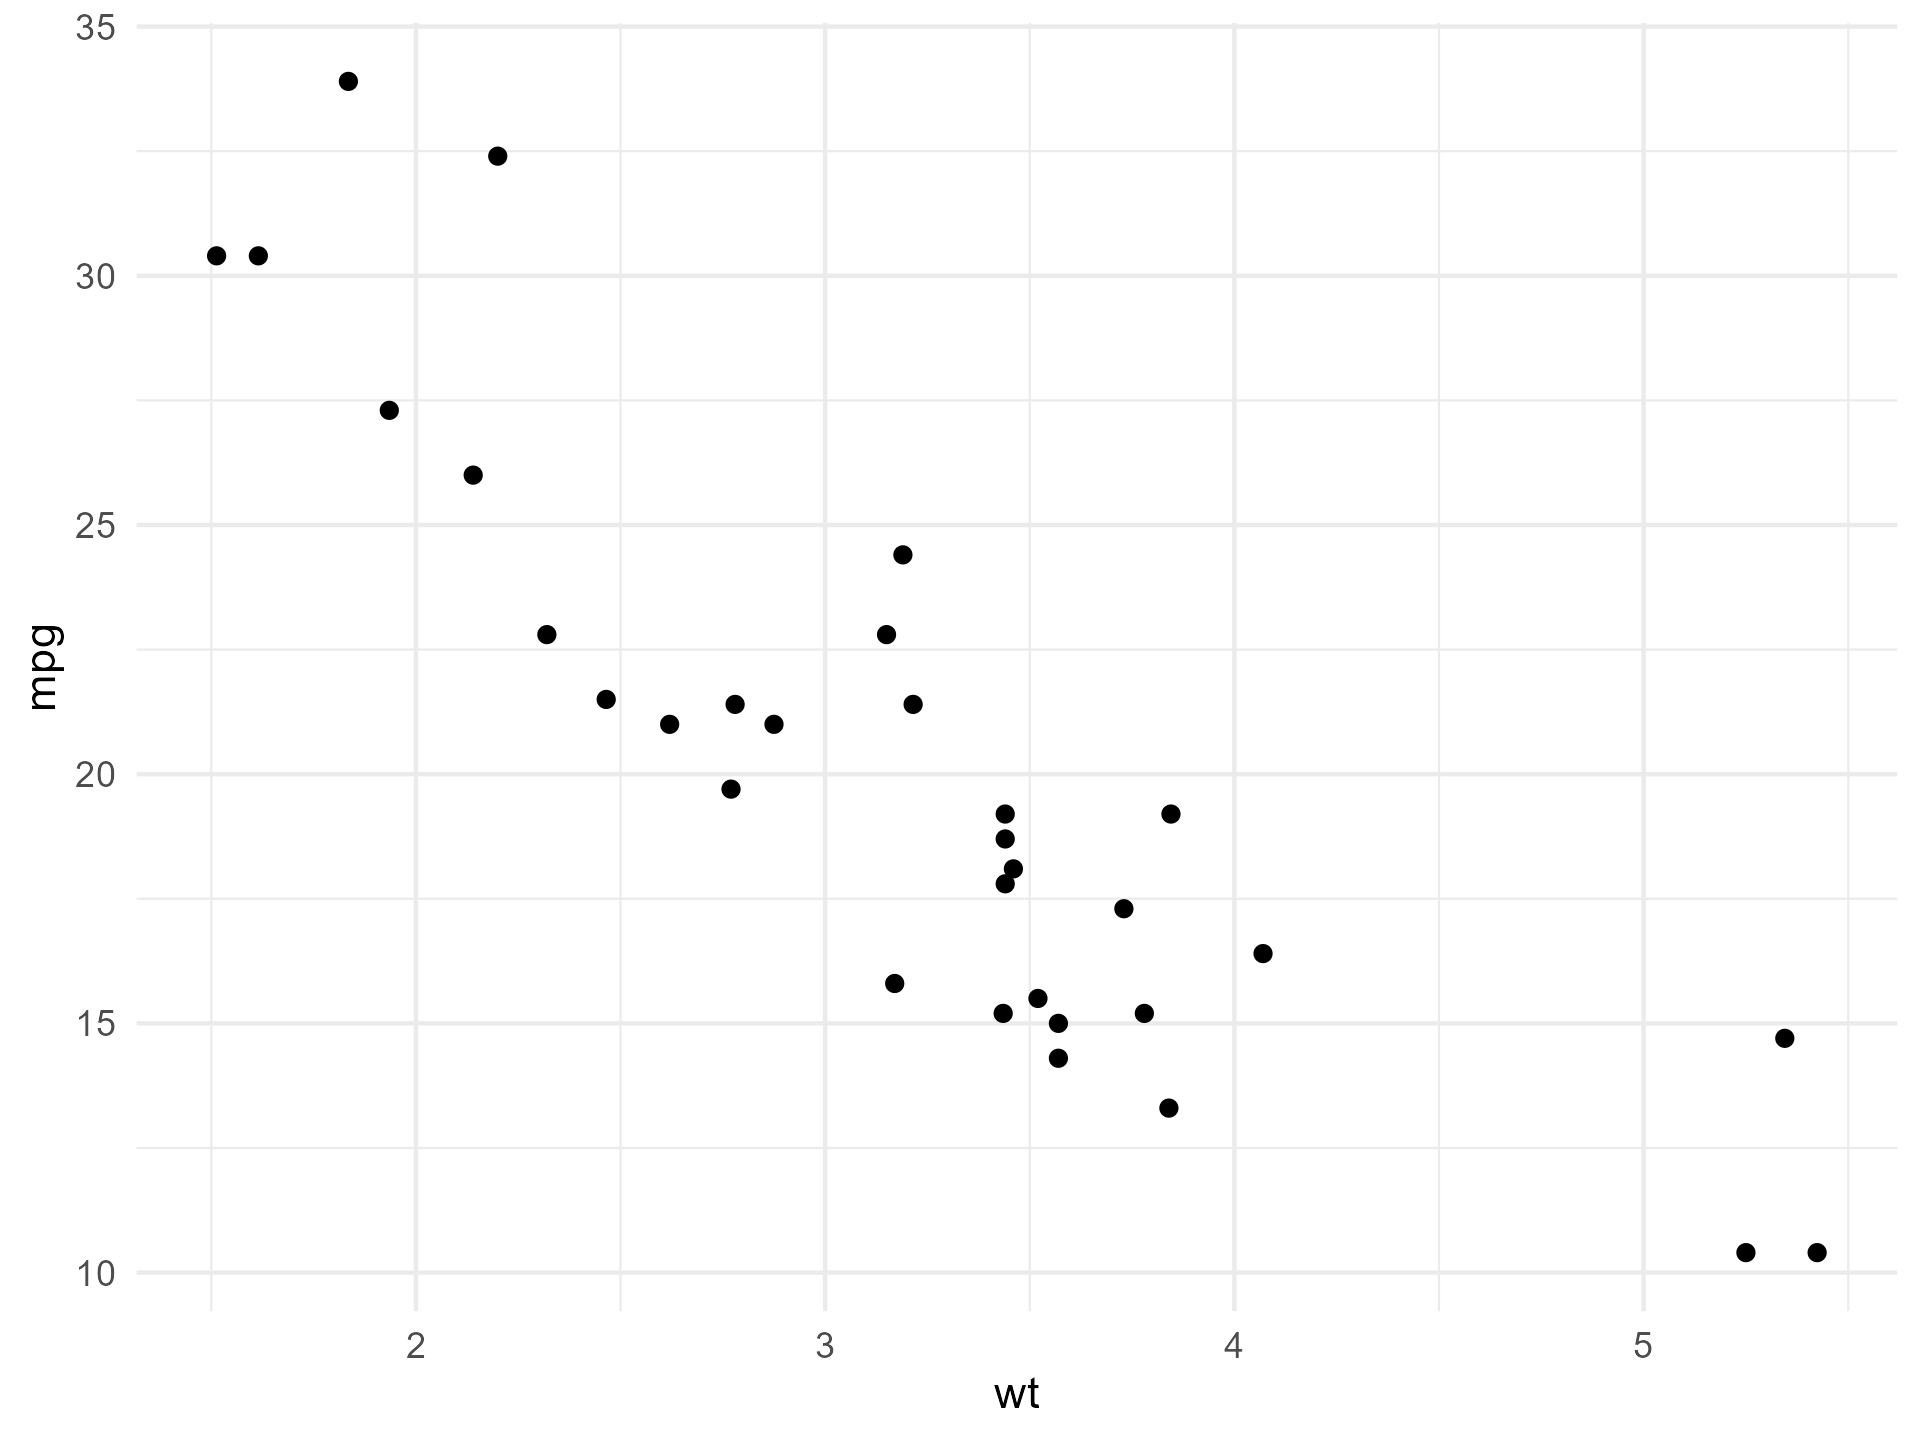
p <- ggplot2::ggplot(mtcars, ggplot2::aes(wt, mpg)) +
  ggplot2::geom_point() +
  ggplot2::theme_minimal()

# 1) Display a temporary PNG
sameplot(p)

# 2) Save a PNG
sameplot(p, file = file.path("figures", "mtcars.png"), save = TRUE)

# 3) Save a TIFF (still displays via a temp PNG for compatibility)
sameplot(p, file = file.path("figures", "mtcars.tiff"), save = TRUE)
Notes
-
Supported output extensions for saving:
.png,.tif,.tiff. -
When
save = FALSE, figures are written to a temporary location and cleaned up when the R session ends. -
dpiin the knitr output is set to the same value asresused for theraggdevice. -
When knitting to HTML with
rmarkdown::html_document, setself_contained: truein the YAML. This ensures the images produced bysameplot()are embedded in the HTML rather than linked as external files in a temporary folder that is not accessible to the HTML when knitting is complete. Example:output: html_document: self_contained: true
sameplot() requires inline output (not “Chunk Output in Console”)
sameplot() is designed for use in .Rmd documents and works by
rendering to an image file (a temporary PNG) and then displaying that
file via knitr::include_graphics().
Because this returns a document output, not an interactive plot object, it does not work with Rstudio’s Chunk Output in Console mode.
To use sameplot() in RStudio, enable inline output: - Click the
settings cogwheel next to the Knit button - Make sure Chunk
Output Inline (not “Chunk Output in Console”) is enabled.
Optional: Matching sameplot() output without using sameplot()
Sometimes you can’t pass a plot object to sameplot(), e.g., when a
function draws immediately and returns NULL. In that case you can
still get device-consistent results with the settings below. Note that
the solution below requires ragg to be installed with
install.packages("ragg").
1) Use ragg for knitr rendering and set chunk options
Set chunk defaults either globally (setup chunk) or per-figure-containing chunk:
dev = "ragg_png"so knitr renders using araggdevicefig.retina = 1to avoid implicit upscalingout.width = "100%"andout.height = "100%"so the sameplot() image fills the same output box as regular chunk figures.- Explicit
fig.width,fig.height, anddpi(these example matchessameplot()defaults)
Example (setup chunk):
knitr::opts_chunk$set(
  dev = "ragg_png",
  fig.retina = 1,
  out.width = "100%",
  out.height = "100%",
  fig.width  = 6.4,
  fig.height = 4.8,
  dpi = 300
)
2) Set AGG backend in RStudio for inline output
In RStudio, set: Tools → Global Options... → General → Graphics
→ Backend → AGG