rpyANTs
An Alternative Advanced Normalization Tools ('ANTs')
Provides portable access from 'R' to biomedical image processing toolbox
'ANTs' by Avants et al. (2009)
rpyANTs

rpyANTs was detached from a RAVE (Reproducible Analysis and
Visualization of iEEG) module. It is now a
standalone package that connects ANTsPy with R using seamless
shared-memory.
This package was originally created for the following three purposes:
- Portability
- Make
ANTseasily accessible from the latest R and all major operating systems - Allow
RAVEor other code/scripts/frameworks to be reproducible since the code will be OS-invariant
- Make
- Easy to install
- Automated installation that requires very little to no knowledge about compilers
- Installing
rpyANTstakes less than 10 minutes - The goal is to have minimum human intervention
- Easy to embed
- Python scripts using
ANTsPycan be executed fromrpyANTsand R with no modification - Built-in bilateral data conversions between Python and R allows image generated from Python to be analyzed/visualized in R and vice versa
- Python scripts using
Disclaimer: This is a third-party maintained R package for
ANTs. If you are looking for theANTsRpackage byB.B Avants, please check here.
Installation
The installation requires one-line extra setup
# Install from CRAN
install.packages("rpyANTs")

# Install from nightly dev builder
# install.packages("rpyANTs", repos = "https://dipterix.r-universe.dev")


# set up ANTs
rpyANTs::install_ants()
install_ants creates an isolated Python environment managed by
RAVE. This environment does not conflict nor affect your existing
Python installations.
Upgrade ANTs
To upgrade ANTs, first update rpyANTs, then upgrade ANTsPyx
install.packages("rpyANTs")
rpymat::add_packages(packages = "antspyx", pip = TRUE)
How to use
To load ANTs
library(rpyANTs)

# Whether ANTs is available
ants_available()

# Load ANTs into R
ants
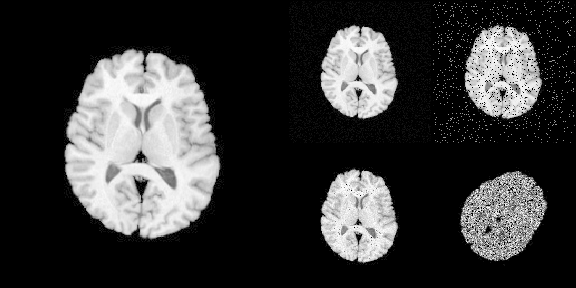
In R, we use $ to get module functions or class members. For example:
ants$add_noise_to_image
#> <ANTs Python Wrapper>
#> Help on function add_noise_to_image in module ants.ops.add_noise_to_image:
#>
#> add_noise_to_image(image, noise_model, noise_parameters)
#>     Add noise to an image using additive Gaussian, salt-and-pepper,
#>     shot, or speckle noise.
#>
#>     Arguments
#>     ---------
#>     image : ANTsImage
#>         scalar image.
#>
#>     noise_model : string
#>         'additivegaussian', 'saltandpepper', 'shot', or 'speckle'.
#>
#>     noise_parameters : tuple or array or float
#>         'additivegaussian': (mean, standardDeviation)
#>         'saltandpepper': (probability, saltValue, pepperValue)
#>         'shot': scale
#>         'speckle': standardDeviation
#>
#>     Returns
#>     -------
#>     ANTsImage
#>
#>     Example
#>     -------
#>     >>> import ants
#>     >>> image = ants.image_read(ants.get_ants_data('r16'))
#>     >>> noise_image = ants.add_noise_to_image(image, 'additivegaussian', (0.0, 1.0))
#>     >>> noise_image = ants.add_noise_to_image(image, 'saltandpepper', (0.1, 0.0, 100.0))
#>     >>> noise_image = ants.add_noise_to_image(image, 'shot', 1.0)
#>     >>> noise_image = ants.add_noise_to_image(image, 'speckle', 1.0)
#>
#> *** Above documentation is for Python.
#> *** Please use `$` instead of `.` for modules and functions in R
#> <function add_noise_to_image at 0x121ab40e0>
#>  signature: (image, noise_model, noise_parameters)
The following R code translates Python code into R:
# >>> img = ants.image_read(ants.get_ants_data('r16'))
img <- ants$image_read(ants$get_ants_data('r16'))

# >>> noise_image1 = ants.add_noise_to_image(img, 'additivegaussian', (0.0, 1.0))
noise_image1 <- ants$add_noise_to_image(
  img, 'additivegaussian',
  noise_parameters = tuple(0.0, 1.0)
)

# >>> noise_image2 = ants.add_noise_to_image(img, 'saltandpepper', (0.1, 0.0, 100.0))
noise_image2 <- ants$add_noise_to_image(
  img, 'saltandpepper',
  noise_parameters = tuple(0.1, 0.0, 100.0)
)

# >>> noise_image3 = ants.add_noise_to_image(img, 'shot', 1.0)
noise_image3 <- ants$add_noise_to_image(
  img, 'shot',
  noise_parameters = 1.0
)

# >>> noise_image4 = ants.add_noise_to_image(img, 'speckle', 1.0)
noise_image4 <- ants$add_noise_to_image(
  img, 'speckle',
  noise_parameters = 1.0
)

# >>> trans = ants.create_ants_transform(
# >>>   dimension=2, matrix=[[0.707, 0.707], [-.707, 0.707]],
# >>>   translation=[-53, 128])
trans <- as_ANTsTransform(matrix(
  c(0.707, 0.707, -53,
    -0.707, 0.707, 128),
  nrow = 2, byrow = TRUE
), dimension = 2)


# >>> noise_image4 = trans.apply_to_image(noise_image4)
noise_image4 <- trans$apply_to_image(noise_image4)
To load imaging data into R
# Use [] to convert ANTsImage into R array
is.array(img[])
#> [1] TRUE

# plot via R
layout(matrix(c(1,1,2,3,1,1,4,5), nrow = 2, byrow = TRUE))
par(mar = c(0.1, 0.1, 0.1, 0.1), bg = "black", fg = "white")
pal <- grDevices::gray.colors(256, start = 0, end = 1)

image(img[], asp = 1, axes = FALSE,
      col = pal, zlim = c(0, 255), ylim = c(1, 0))
image(noise_image1[], asp = 1, axes = FALSE,
      col = pal, zlim = c(0, 255), ylim = c(1, 0))
image(noise_image2[], asp = 1, axes = FALSE,
      col = pal, zlim = c(0, 255), ylim = c(1, 0))
image(noise_image3[], asp = 1, axes = FALSE,
      col = pal, zlim = c(0, 255), ylim = c(1, 0))
image(noise_image4[], asp = 1, axes = FALSE,
      col = pal, zlim = c(0, 255), ylim = c(1, 0))
Advanced use case
Run/Debug Python scripts
rpyANTs ports functions that allows to run Python scripts. For
example:
library(rpyANTs)

script_path <- tempfile(fileext = ".py")
writeLines(con = script_path, text = r"(

# This is Python script
import ants
print(ants.__version__)

)")

run_script(script_path)
#> 0.6.3
You can also run Python interactive in R (yes, you are correct).
Simply run
rpyANTs::repl_python()
The console prefix will change from > to >>>, meaning you are in
Python mode:
> rpyANTs::repl_python()
Python 3.8.16 (/Users/dipterix/Library/r-rpymat/miniconda/envs/rpymat-conda-env/bin/python3.8)
Reticulate 1.26 REPL -- A Python interpreter in R.
Enter 'exit' or 'quit' to exit the REPL and return to R.
>>>
Try some Python code!
>>> import ants
>>> help(ants.registration)
To exit Python mode, type exit (no parenthesis) and hit enter key
>>> exit
>
Data conversions
Native R variables can be easily converted to Python and back via
r_to_py and py_to_r.
For example
# R to Python
r_to_py(1)
#> 1.0
r_to_py(1L)
#> 1

# Python to R
py_obj <- py_list(1:3)
class(py_obj)  # <- this is a python object
#> [1] "python.builtin.list"   "python.builtin.object"

py_to_r(py_obj)
#> [1] 1 2 3
You can also use variables created in R from Python or vice versa:
In the following example, an R object object_r is created. In Python,
it can be accessed (read-only) via r.object_r
> object_r <- c(1,2,3)
> repl_python()
Python 3.8.16 (/Users/dipterix/Library/r-rpymat/miniconda/envs/rpymat-conda-env/bin/python3.8)
Reticulate 1.26 REPL -- A Python interpreter in R.
Enter 'exit' or 'quit' to exit the REPL and return to R.
>>> r.object_r
[1.0, 2.0, 3.0]
Similarly, a Python object object_py is created, and it can be read
from py$object_py:
>>> import numpy as np
>>> object_py = np.array([2,3,4])
>>> exit
> py$object_py
[1] 2 3 4
Known issues
Variable types
R is not a type-rigid language. Some functions in ANTsPy require
specific variable types that are often vague in R. For example the
dimension argument in function ants$create_ants_transform needs to
be an integer, but R’s default numerical values are double. In this
case, variable formats need to be explicitly given.
Here are several examples
- Explicit integers
# ants$create_ants_transform(dimension = 3)     # <- error
ants$create_ants_transform(dimension = 3L)      # < XXXL is an explicit integer
Tuple,list, anddictionary
A Python tuple is a vector that cannot alter lengths.
# Wrong as `aff_iterations` needs to be a tuple
# ants$registration(fixed, moving, ..., aff_iterations = c(6L, 4L, 2L, 1L))

ants$registration(fixed, moving, ..., aff_iterations = tuple(6L, 4L, 2L, 1L))
Similar conversions can be done via py_list, py_dict.
- Convert
TRUEvs.FALSE
A Python module can be imported with auto-conversion (argument
convert) set to TRUE or FALSE. When auto-conversion is on, the
Python function results will be converted to R objects automatically.
For example,
np <- import("numpy", convert = TRUE)
np$eye(4L)
#>      [,1] [,2] [,3] [,4]
#> [1,]    1    0    0    0
#> [2,]    0    1    0    0
#> [3,]    0    0    1    0
#> [4,]    0    0    0    1
The numpy array is automatically translated as an R matrix. While this
is convenient, this automated conversion could cause some issues when
the function results are further passed into another Python function.
For example, the following code will raise errors.
> np <- import("numpy", convert = TRUE)
> ants <- load_ants()
>
> image <- ants$image_read(ants$get_ants_data('mni'))
> image_array <- np$asarray(list(image, image))
>
> ants$plot_grid(image_array, slices = 100L)

Error in py_call_impl(callable, dots$args, dots$keywords) :
Matrix type cannot be converted to python (only integer, numeric, complex, logical, and character matrixes can be converted
The error is raised because numpy has convert=TRUE, hence
image_array is converted to an R list with each element being a
ANTsImage instance. Calling ants$plot_grid needs R-to-Python
conversion for all input variables, including image_array. However
this conversion makes image_array a Python list instead of numpy
array, violating the input format.
A safer way is to keep in the Python format, i.e. convert=FALSE. In
this mode, function results will not be converted back to R (you need to
manually make conversion by yourself via py_to_r). Now the following
example works.
> np <- import("numpy", convert = TRUE)
> ants <- load_ants()
>
> image <- ants$image_read(ants$get_ants_data('mni'))
> image_array <- np$asarray(list(image, image))
>
> ants$plot_grid(image_array, slices = 100L)
Object
antsinrpyANTsis a non-conversion Python module. Objectpyis a auto-conversion Python module
Operators
In Python, operators on ANTsImage, such as img > 5 are defined. Such
operators is being supported in R as S3 generic functions. Don’t worry
if you don’t know what is S3 generic, see the following examples:
library(rpyANTs)
image <- ants$image_read(ants$get_ants_data('mni'))
print(image)
dim(image)
range(image)

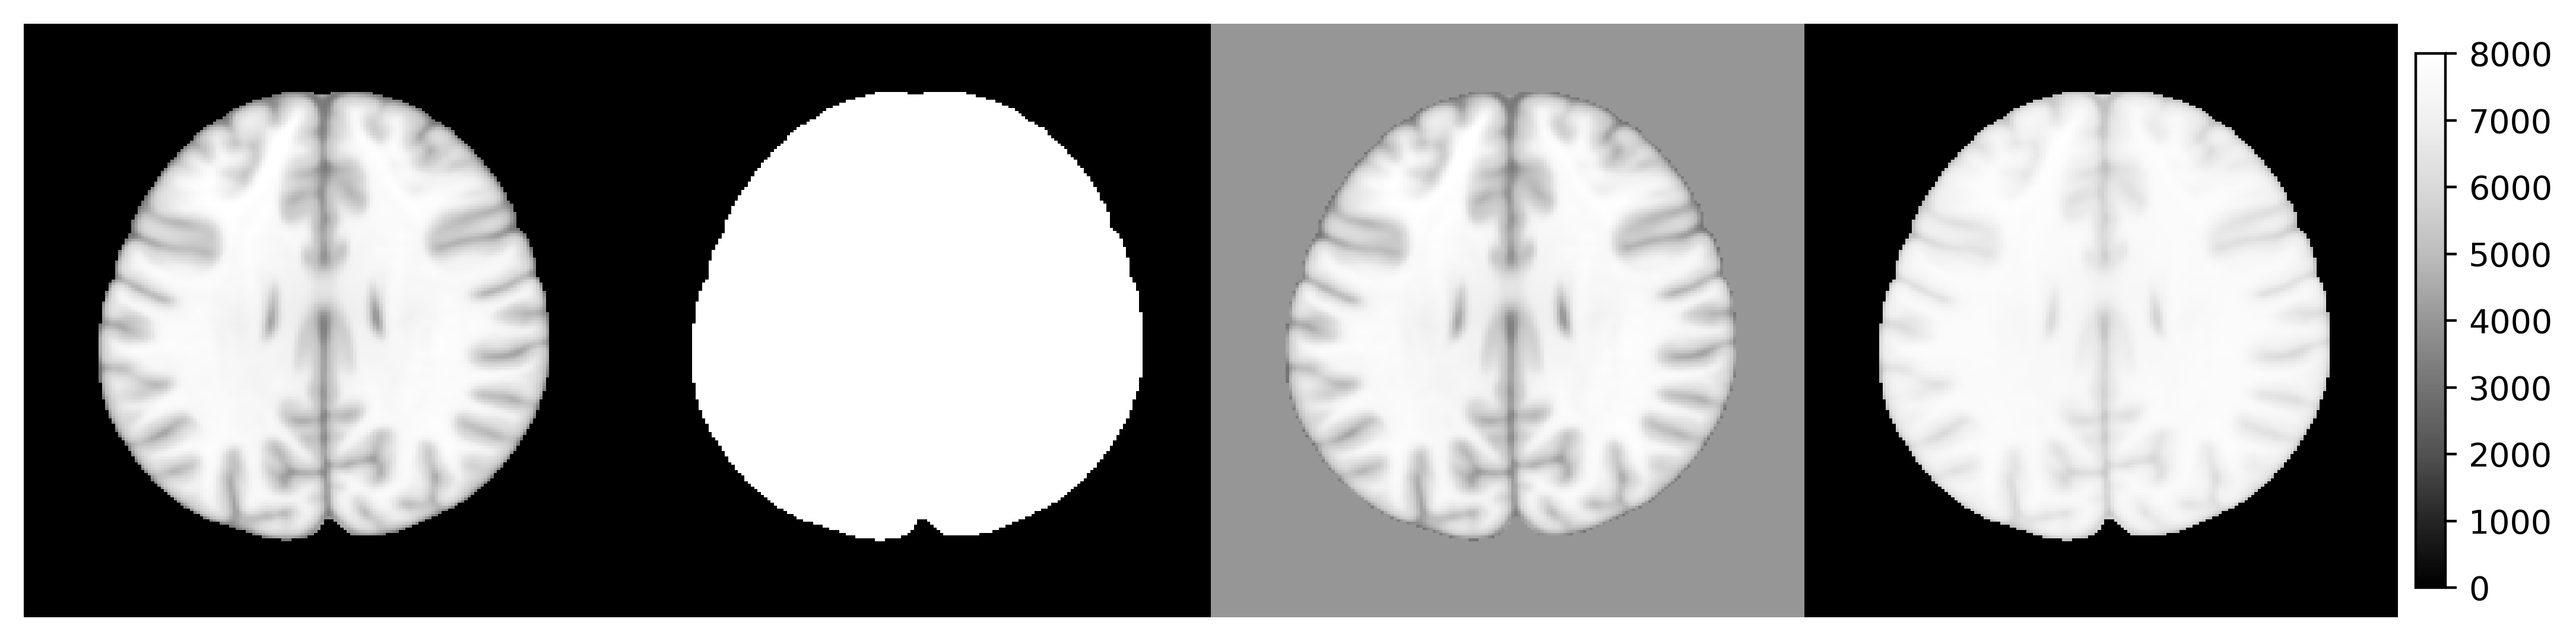
y1 <- (image > 10) * 8000

y2 <- image
y2[y2 < 10] <- 4000

y3 <- log(image + 1000)
y3 <- (y3 - min(y3)) / (max(y3) - min(y3)) * 8000

ants_plot_grid(
  list(image, y1, y2, y3),
  slices = 100, shape = c(1, 4),
  vmin = 0, vmax = 8000
)
Although the operator generics have been implemented for common classes
such as ANTsImage and ANTsTransform. Many are still under
development and not supported. In this case, you might want to use the
following workaround methods. You are more than welcome to post a
wish-list or issue ticket to the Github
repository
Alternative version 1: call operators directly
library(rpyANTs)
image <- ants$image_read(ants$get_ants_data('r16'))

# The followings are the same
# threshold <- image > 10
threshold <- image$`__gt__`(10)
ants$plot(threshold)
Work-around version 2: If you don’t know how Python operators work, use Python directly
library(rpyANTs)
image <- ants$image_read(ants$get_ants_data('r16'))

# Create an R variable from Python!
py_run_string("r.threshold = r.image > 10", local = TRUE, convert = FALSE)
ants$plot(threshold)
Citation
This is a general citation for ANTs:
Avants, B.B., Tustison, N. and Song, G., 2009. Advanced normalization tools (ANTS). The Insight Journal, 2(365), pp.1-35.
If you are using rpyANTs through RAVE or YAEL, please also cite:
Magnotti, J.F., Wang, Z. and Beauchamp, M.S., 2020. RAVE: Comprehensive open-source software for reproducible analysis and visualization of intracranial EEG data. NeuroImage, 223, p.117341.
License
This package rpyANTs is released under Apache-2.0 license (Copyright:
Zhengjia Wang). The underlying ANTsPy is released under Apache-2.0
license (Copyright: ANTs contributors).