plausibounds
Plausible Bounds for Treatment Path Estimates
Enhances dynamic effect plots as suggested in Freyaldenhoven and Hansen (2026) < https://simonfreyaldenhoven.github.io/papers/Plausible_bounds.pdf>. Data-driven smoothing delivers a smooth estimated path with potentially improved point estimation properties and confidence regions covering a surrogate that can be substantially tighter than conventional pointwise or uniform bands.
plausibounds
Overview
The plausibounds package implements the additions to dynamic effect
plots suggested in Freyaldenhoven and Hansen
(2026).
Data-driven smoothing delivers a smooth estimated path with potentially
improved point estimation properties and confidence regions covering a
surrogate that can be substantially tighter than conventional pointwise
or uniform bands.
Installation
# Install from CRAN
install.packages("plausibounds")

# Install latest version from GitHub
install.packages("devtools")
devtools::install_github("SimonFreyaldenhoven/plausibounds")
Usage
Find a minimal example below. For more information see the package documentation and vignette.
library(plausibounds)
library(ggplot2)

set.seed(916)

# Load example data
data(estimates_bighump)
data(var_bighump)

# Compute restricted bounds for 1 year of estimates
pb <- plausible_bounds(
  estimates = estimates_bighump[1:12],
  var = var_bighump[1:12, 1:12]
)
# View results
summary(pb)
#> Summary of Plausible Bounds Results
#> -----------------------------------
#>
#>  horizon unrestr_est   restr_est restr_lower restr_upper
#>        1 -0.66903837 -0.66982871  -1.0365520 -0.30310545
#>        2 -0.66763389 -0.69318534  -1.0054594 -0.38091130
#>        3 -0.70083047 -0.62323523  -0.9264787 -0.31999175
#>        4 -0.46328837 -0.42801204  -0.6914514 -0.16457266
#>        5 -0.19787913 -0.19479113  -0.4171090  0.02752676
#>        6  0.01726552 -0.04222150  -0.2648770  0.18043404
#>        7  0.02363984 -0.02922778  -0.2539854  0.19552986
#>        8 -0.00735812 -0.03316318  -0.2561817  0.18985538
#>        9  0.17318567 -0.02993512  -0.2530062  0.19313599
#>       10 -0.05252205 -0.04318350  -0.2676068  0.18123976
#>       11 -0.22910158 -0.05518904  -0.2818020  0.17142388
#>       12 -0.09026334 -0.05172993  -0.2808989  0.17743903

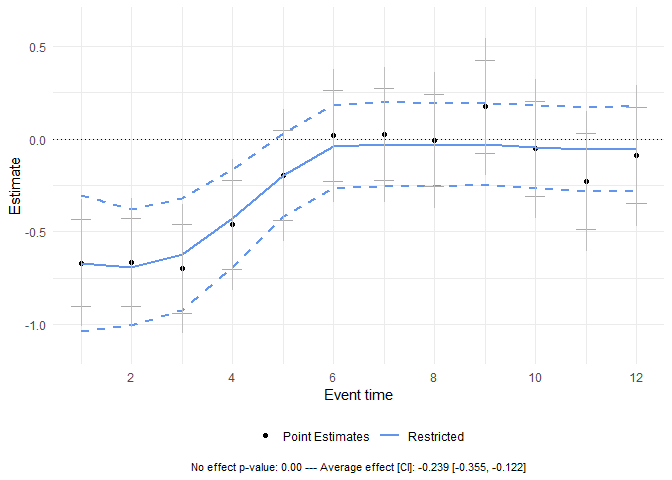
# Visualize bounds
create_plot(pb)
# Example with parallel processing
pb_parallel <- plausible_bounds(
  estimates = estimates_bighump,
  var = var_bighump,
  alpha = 0.05,
  parallel = TRUE,
  n_cores = 4
)
Citation
Simon Freyaldenhoven, Christian Hansen. “(Visualizing) Plausible Treatment Effect Paths.” Federal Reserve Bank of Philadelphia and University of Chicago, 2026.
Simon Freyaldenhoven, Christian Hansen, Ryan Kobler. “plausibounds
package.” Code and data repository at
https://github.com/SimonFreyaldenhoven/plausibounds, 2026.