nlstimedist
Non-Linear Model Fitting of Time Distribution of Biological Phenomena
Fit biologically meaningful distribution functions to
time-sequence data (phenology), estimate parameters to draw the cumulative
distribution function and probability density function and calculate
standard statistical moments and percentiles. These methods are described in
Steer et al. (2019)
{nlstimedist}



{nlstimedist} fits a biologically meaningful distribution function to time-sequence data (phenology), estimates parameters to draw the cumulative distribution function and probability density function and calculates standard statistical moments and percentiles.
Installation
You can install:
- the latest released version from CRAN with
install.packages("nlstimedist")
- the latest development version from GitHub with
# install.packages("remotes")
remotes::install_github("nathaneastwood/nlstimedist")
Usage
Preparing the data
Data should be in tidy format. {nlstimedist} provides three example tidy
datasets: lobelia, pupae and tilia.
library(nlstimedist)
head(tilia)
#   Day Trees
# 1  94     0
# 2  95     0
# 3  96     1
# 4 103     1
# 5 104     0
# 6 105     3
We first need to calculate the cumulative number of trees as well as the
proportions. We do this using the tdData() function.
tdTilia <- tdData(tilia, x = "Day", y = "Trees")
tdTilia
#    Day Trees cumN    propMax
# 3   96     1    1 0.01538462
# 4  103     1    2 0.03076923
# 6  105     3    5 0.07692308
# 8  107     1    6 0.09230769
# 10 110     4   10 0.15384615
# 11 111     7   17 0.26153846
# 12 112     3   20 0.30769231
# 14 114     1   21 0.32307692
# 15 115     3   24 0.36923077
# 16 116     6   30 0.46153846
# 18 117     3   33 0.50769231
# 19 118     2   35 0.53846154
# 20 119     2   37 0.56923077
# 21 120     5   42 0.64615385
# 22 121     2   44 0.67692308
# 23 122     2   46 0.70769231
# 24 123     4   50 0.76923077
# 25 124     1   51 0.78461538
# 27 126     3   54 0.83076923
# 28 127     1   55 0.84615385
# 29 128     1   56 0.86153846
# 30 129     1   57 0.87692308
# 31 130     2   59 0.90769231
# 32 131     4   63 0.96923077
# 33 133     1   64 0.98461538
# 34 134     1   65 1.00000000
Fitting the model
We fit the model to the proportion of the cumulative number of trees
(propMax) in the tdTilia object using the timedist() function.
model <- timedist(data = tdTilia, x = "Day", y = "propMax", r = 0.1, c = 0.5, t = 120)
model
# Nonlinear regression model
#   model: propMax ~ 1 - (1 - (r/(1 + exp(-c * (Day - t)))))^Day
#    data: data
#         r         c         t
#   0.02721   0.17126 124.84320
#  residual sum-of-squares: 0.01806
#
# Number of iterations to convergence: 10
# Achieved convergence tolerance: 1.49e-08
Extracting the moments
We can extract the mean, variance, standard deviation, skew, kurtosis and entropy of the model as follows.
model$m$getMoments()
#       mean variance       sd     skew kurtosis entropy
# 1 118.0325 180.7509 13.44436 4.324762 46.82073 5.36145
Extracting the RSS
Similarly we can extract the RSS of the model
model$m$rss()
# [1] 0.9930469
Plotting the PDF and CDF
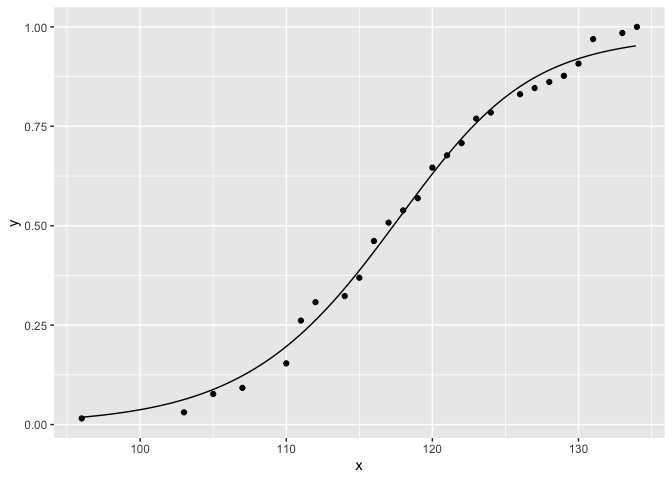
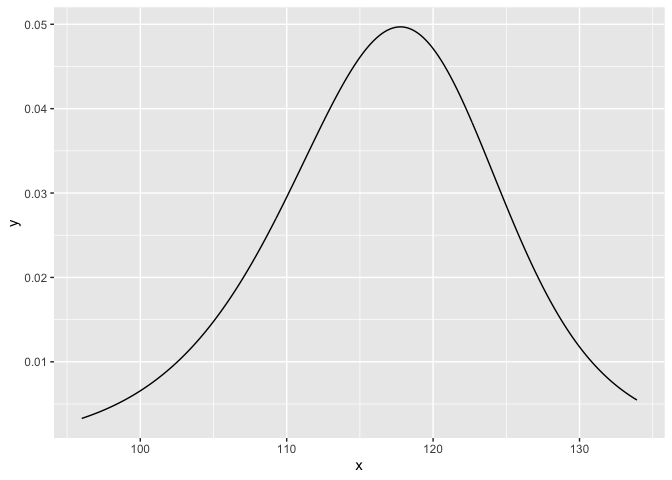
The probability density function (PDF) and the cumulative distribution function (CDF) of the model have their own plotting functions.
tdPdfPlot(model)
tdCdfPlot(model)