netmem
Social Network Measures using Matrices
Provides measures to describe and manipulate one-mode, two-mode,
multiplex, and multilevel networks using matrix algebra. Implements
functions for network centrality, cohesive subgroups, communities,
structural holes, roles and positions, similarity measures, path distances,
signed networks, segregation, social influence, and random network
generation. Supports ego-centric and whole-network analyses, including
dyadic and triadic censuses, structural balance, bipartite projections,
measures with overlapping group memberships, Q-analysis,
neighbourhood-inclusion dominance, main path analysis of citation networks,
and permutation tests for networks.
Key references: Bonacich (1972)
netmem: Network Measures using Matrices 



The goal of netmem is to make
available different measures to analyse and manipulate complex networks
using matrices.
🖊 Author/maintainer: Alejandro Espinosa-Rada
🏫 Current: Institute of Sociology, Pontificia Universidad Católica de Chile
🏫 Before: Social Networks Lab, ETH Zürich


The package implements different measures to analyse and manipulate complex multilayer networks, from an ego-centric perspective, considering one-mode networks, valued ties (i.e. weighted or multiplex) or with multiple levels.
The package comes with three vignettes, listed in the
articles of the website
and available from R once netmem is installed:
vignette("netmem") # Getting started with netmem
vignette("distinctive") # What netmem adds
vignette("multilayer") # Multilayer networks
Citation
Espinosa-Rada A (2026). netmem: Social Network Measures using Matrices. R package version 1.1-0, https://github.com/anespinosa/netmem.
@Manual{,
  title = {netmem: Social Network Measures using Matrices},
  author = {Alejandro Espinosa-Rada},
  year = {2026},
  note = {R package version 1.1-0},
  url = {https://github.com/anespinosa/netmem},
}
Functions currently available in netmem:
Utilities:
-
matrix_report(): Matrix report -
matrix_adjlist(): Transform a matrix into an adjacency list -
matrix_projection(): Unipartite projections -
matrix_to_edgelist(): Transform a square matrix into an edge-list -
adj_to_matrix(): Transform an adjacency list into a matrix -
adj_to_incidence(): Transform an adjacency matrix into a incidence matrix -
cumulativeSumMatrices(): Cumulative sum of matrices -
edgelist_to_matrix(): Transform an edgelist into a matrix -
expand_matrix(): Expand matrix -
extract_component(): Extract components -
hypergraph(): Hypergraphs -
perm_matrix(): Permutation matrix -
perm_label(): Permute labels of a matrix -
power_function(): Power of a matrix -
meta_matrix(): Meta matrix for multilevel networks -
supra_adjacency(): Supra-adjacency matrix of the layers of a multiplex network -
aggregate_layers(): Aggregation of the layers into a single matrix -
minmax_overlap(): Minimum/maximum overlap -
mix_matrix(): Mixing matrix -
simplicial_complexes(): Simplicial complexes -
structural_na(): Structural missing data -
ego_net(): Ego network -
zone_sample(): Zone-2 sampling from second-mode
Ego and personal networks:
-
eb_constraint(): Constraint -
ei_index(): Krackhardt and Stern’s E-I index -
heterogeneity(): Blau’s and IQV index -
redundancy(): Redundancy measures -
structural_holes(): Effective size, efficiency and constraint of every node, with overlapping categories -
alter_composition(): Categories of the alters, which can overlap -
alter_heterogeneity(): Heterogeneity of the alters, with overlapping categories -
alter_homophily(): E-I index and Yule’s Q of every node, with overlapping categories -
brokerage_roles(): Gould and Fernandez brokerage roles, with overlapping categories
Path distances:
-
bfs_ugraph(): Breath-first algorithm -
compound_relation(): Relational composition -
count_geodesics(): Count geodesic distances -
short_path(): Shortest path -
wlocal_distances(): Dijkstra’s algorithm (one actor) -
wall_distances(): Dijkstra’s algorithm (all actors) -
geo_distances(): Matrix of geodesic distances -
geo_summary(): Diameter, average distance and reachability
Signed networks:
-
posneg_index(): Positive-negative centrality -
struc_balance(): Structural balance -
eigenvector_centrality(signed = TRUE): Status with negative relations
Structural measures:
-
gen_density(): Generalized density -
recip_coef(): Reciprocity -
trans_coef(): Transitivity -
trans_matrix(): Transitivity matrix -
components_id(): Components -
k_core(): Generalized k-core -
dyadic_census(): Dyad census -
multiplex_census(): Multiplex triad census -
mixed_census(): Multilevel triad and quadrilateral census -
krackhardt_index(): Connectedness, hierarchy, efficiency and upper boundedness -
core_periphery(): Core-periphery structures
Cohesive subgroups:
-
clique_table(): Clique table -
dyad_triad_table(): Forbidden triad table -
percolation_clique(): Clique percolation -
q_analysis(): Q-analysis -
shared_partners(): Shared partners -
clique_max(): Maximal cliques
Similarity measures:
-
bonacich_norm(): Bonacich normalization -
co_occurrence(): Co‐occurrence -
dist_sim_matrix(): Structural similarities -
fractional_approach(): Fractional approach -
jaccard(): Jaccard similarity
Network inference:
-
kp_reciprocity(): Reciprocity of Katz and Powell -
z_arctest(): Z test of the number of arcs -
triad_uman(): Triad census analysis assuming U|MAN -
ind_rand_matrix(): Independent random matrix -
cug_test(): Conditional uniform graph test -
qap_cor(): QAP correlation -
qap_lm(): MRQAP regression, linear and logistic -
small_world(): Watts-Strogatz networks -
pref_attachment(): Barabasi-Albert networks
Centrality:
-
gen_degree(): Generalized degree -
multilevel_degree(): Degree centrality for multilevel networks -
closeness_centrality(): Closeness and harmonic closeness -
betweenness_centrality(): Betweenness -
eigenvector_centrality(): Eigenvector centrality -
katz_centrality(): Katz centrality -
bonacich_power(): Bonacich power centrality -
page_rank_centrality(): PageRank -
centrality_centralization(): Centralization of the network -
partition_centrality(): Contribution of each category to the centrality of every node
Positions and dominance:
-
neigh_inclusion(): Neighbourhood-inclusion preorder -
dir_inclusion(): Directed neighbourhood-inclusion criteria -
pos_dominance(): Positional dominance on indirect relations -
indirect_rel(): Indirect relations between the nodes -
set_inclusion(): Inclusion of neighbourhoods -
pareto_dominance(): Dominance across several relations -
hyperevent_dominance(): Dominance through citation chains -
dominance_pairs(): Comparable and incomparable pairs -
dominance_layers(): Layers and status of a dominance relation -
dominance_ranks(): Rank intervals -
preserved_order(): Whether a centrality preserves a dominance relation
Roles and positions:
-
block_density(): Block densities and image matrix -
concor(): CONCOR -
rege(): Regular equivalence
Communities:
-
leiden(): Leiden and Louvain communities -
leading_eigen(): Leading eigenvector communities -
community_greedy(): Agglomerative modularity -
community_label(): Label propagation -
community_betweenness(): Girvan-Newman edge betweenness -
modularity_score(): Modularity, including LinkRank
Segregation and homophily:
segregation(): Assortativity, Gupta-Anderson-May, odds ratio, Coleman and Freeman
Social influence and diffusion:
-
social_influence(): Assimilation, bounded confidence, repulsion and Friedkin-Johnsen -
threshold_diffusion(): Threshold models of diffusion
Citation networks:
-
main_path(): Main path analysis -
traversal_weights(): Search path counts -
citation_decay(): Temporal decay of citations -
dag_check(): Directed acyclic graphs -
main_path_diag(): Diagnostics of the main path
Geographic information:
-
dist_geographic(): Geographical distances -
spatial_cor(): Spatial autocorrelation
Data currently available:
-
FIFAego: Ego FIFA -
FIFAex: Outside FIFA -
FIFAin: Inside FIFA -
krackhardt_friends: Krackhardt friends -
lazega_lawfirm: Lazega Law Firm -
campnet: Camp 92 network
Additional data in
classicnets: Classic Data of Social Networks
Scope
The functions work on matrices, which keeps the code close to the
algebra of the measures and makes them easy to read and to check. The
results are compared with igraph, sna, netrankr and netseg in
the validation scripts of the repository. The package is meant for the
networks that are usually collected by hand, up to a few hundred nodes;
for larger networks the compiled routines of igraph are orders of
magnitude faster.
Quick overview of netmem: Network Measures using Matrices
Installation
From CRAN:
# install.packages("netmem")
library(netmem)
You can install the development version from GitHub with:
### OPTION 1
# install.packages("devtools")
devtools::install_github("anespinosa/netmem")

### OPTION 2
options(repos = c(
  netmem = "https://anespinosa.r-universe.dev",
  CRAN = "https://cloud.r-project.org"
))
install.packages("netmem")
Multilevel Networks
Connections between individuals are often embedded in complex structures, which shape actors’ expectations, behaviours and outcomes over time. These structures can themselves be interdependent and exist at different levels. Multilevel networks are a means by which we can represent this complex system by using nodes and edges of different types. Check this book edited by Emmanuel Lazega and Tom A.B. Snijders or this book edited by David Knoke, Mario Diani, James Hollway and Dimitris Christopoulos.
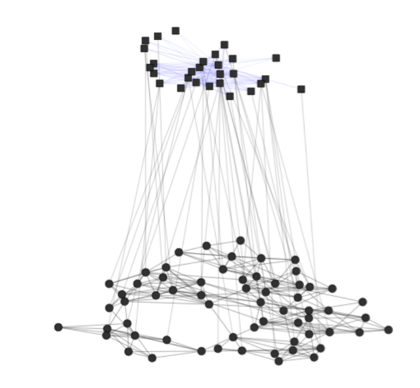
For multilevel structures, we tend to collect the data in different matrices representing the variation of ties within and between levels. Often, we describe the connection between actors as an adjacency matrix and the relations between levels through incidence matrices. The comfortable combination of these matrices into a common structure would represent the multilevel network that could be highly complex.
Example
Let’s assume that we have a multilevel network with two adjacency matrices, one valued matrix and two incidence matrices between them.
-
A1: Adjacency Matrix of the level 1 -
B1: incidence Matrix between level 1 and level 2 -
A2: Adjacency Matrix of the level 2 -
B2: incidence Matrix between level 2 and level 3 -
A3: Valued Matrix of the level 3
Create the data
A1 <- matrix(c(
  0, 1, 0, 0, 1,
  1, 0, 0, 1, 1,
  0, 0, 0, 1, 1,
  0, 1, 1, 0, 1,
  1, 1, 1, 1, 0
), byrow = TRUE, ncol = 5)

B1 <- matrix(c(
  1, 0, 0,
  1, 1, 0,
  0, 1, 0,
  0, 1, 0,
  0, 1, 1
), byrow = TRUE, ncol = 3)

A2 <- matrix(c(
  0, 1, 1,
  1, 0, 0,
  1, 0, 0
), byrow = TRUE, nrow = 3)

B2 <- matrix(c(
  1, 1, 0, 0,
  0, 0, 1, 0,
  0, 0, 1, 1
), byrow = TRUE, ncol = 4)

A3 <- matrix(c(
  0, 1, 3, 1,
  1, 0, 0, 0,
  3, 0, 0, 5,
  1, 0, 5, 0
), byrow = TRUE, ncol = 4)
We will start with a report of the matrices:
matrix_report(A1)
#> The matrix A might have the following characteristics:
#> --> The vectors of the matrix are `numeric`
#> --> No names assigned to the rows of the matrix
#> --> No names assigned to the columns of the matrix
#> --> Matrix is symmetric (network is undirected)
#> --> The matrix is square, 5 by 5
#>      nodes edges
#> [1,]     5     7
matrix_report(B1)
#> The matrix A might have the following characteristics:
#> --> The vectors of the matrix are `numeric`
#> --> No names assigned to the rows of the matrix
#> --> No names assigned to the columns of the matrix
#> --> The matrix is rectangular, 3 by 5
#>      nodes_rows nodes_columns incidence_lines
#> [1,]          3             5               7
matrix_report(A2)
#> The matrix A might have the following characteristics:
#> --> The vectors of the matrix are `numeric`
#> --> No names assigned to the rows of the matrix
#> --> No names assigned to the columns of the matrix
#> --> Matrix is symmetric (network is undirected)
#> --> The matrix is square, 3 by 3
#>      nodes edges
#> [1,]     3     2
matrix_report(B2)
#> The matrix A might have the following characteristics:
#> --> The vectors of the matrix are `numeric`
#> --> No names assigned to the rows of the matrix
#> --> No names assigned to the columns of the matrix
#> --> The matrix is rectangular, 4 by 3
#>      nodes_rows nodes_columns incidence_lines
#> [1,]          4             3               5
matrix_report(A3)
#> The matrix A might have the following characteristics:
#> --> The vectors of the matrix are `numeric`
#> --> No names assigned to the rows of the matrix
#> --> No names assigned to the columns of the matrix
#> --> Valued matrix
#> --> Matrix is symmetric (network is undirected)
#> --> The matrix is square, 4 by 4
#>      nodes edges
#> [1,]     4    10
What is the density of some of the matrices?
matrices <- list(A1, B1, A2, B2)
gen_density(matrices, multilayer = TRUE)
#> $`Density of matrix [[1]]`
#> [1] 0.7
#>
#> $`Density of matrix [[2]]`
#> [1] 0.4666667
#>
#> $`Density of matrix [[3]]`
#> [1] 0.6666667
#>
#> $`Density of matrix [[4]]`
#> [1] 0.4166667
How about the degree centrality of the entire structure?
multilevel_degree(A1, B1, A2, B2, complete = TRUE)
#>    multilevel bipartiteB1 bipartiteB2 tripartiteB1B2 low_multilevel
#> n1          3           1          NA              1              3
#> n2          5           2          NA              2              5
#> n3          3           1          NA              1              3
#> n4          4           1          NA              1              4
#> n5          6           2          NA              2              6
#> m1          6           2           2              4              4
#> m2          6           4           1              5              5
#> m3          4           1           2              3              3
#> k1          1          NA           1              1              1
#> k2          1          NA           1              1              1
#> k3          2          NA           2              2              2
#> k4          1          NA           1              1              1
#>    meso_multilevel high_multilevel
#> n1               1               1
#> n2               2               2
#> n3               1               1
#> n4               1               1
#> n5               2               2
#> m1               6               4
#> m2               6               5
#> m3               4               3
#> k1               1               1
#> k2               1               1
#> k3               2               2
#> k4               1               1
Besides, we can perform a k-core analysis of one of the levels using the information of an incidence matrix
k_core(A1, B1, multilevel = TRUE)
#> [1] 3 3 3 3 3
This package also allows performing complex census for multilevel networks.
mixed_census(A2, t(B1), B2, quad = TRUE)
#>   000   100   001   010   020   200  11D0  11U0   120   210   220   002  01D1
#>     2     6     1     0     0     2     0     0     4     0     1     1     0
#>  01U1   012   021   022  101N  101P   201   102   202 11D1W 11U1P 11D1P 11U1W
#>     0     0     8     0     3     0     1     3     1     0     0     0     0
#>  121W  121P  21D1  21U1  11D2  11U2   221   122   212   222
#>    11    13     0     0     0     0     3     0     0     0
Ego measures
When we are interested in one particular actor, we could perform
different network measures. For example, actor e has connections with
all the other actors in the network. Therefore, we could estimate some
of Ronald Burt’s measures.
# First we will assign names to the matrix
rownames(A1) <- letters[1:nrow(A1)]
colnames(A1) <- letters[1:ncol(A1)]

eb_constraint(A1, ego = "e")
#> $results
#>   term1 term2 term3 constraint normalization
#> e  0.25 0.292 0.101      0.642         0.761
#>
#> $maximum
#>     e
#> 0.766
redundancy(A1, ego = "e")
#> $redundancy
#> [1] 1.5
#>
#> $effective_size
#> [1] 2.5
#>
#> $efficiency
#> [1] 0.625
Also, sometimes we might want to subset a group of actors surrounding an ego.
ego_net(A1, ego = "e")
#>   a b c d
#> a 0 1 0 0
#> b 1 0 0 1
#> c 0 0 0 1
#> d 0 1 1 0
One-mode network
This package expand some measures for one-mode networks, such as the
generalized degree centrality. Suppose we consider a valued matrix A3.
If alpha=0 then it would only count the direct connections. But,
adding the tuning parameter alpha=0.5 would determine the relative
importance of the number of ties compared to tie weights.
gen_degree(A3, digraph = FALSE, weighted = TRUE)
#> [1] 3.872983 1.000000 4.000000 3.464102
Also, we could conduct some exploratory analysis using the normalized degree of an incidence matrix.
gen_degree(B1, bipartite = TRUE, normalized = TRUE)
#> $bipartiteL1
#> [1] 0.3333333 0.6666667 0.3333333 0.3333333 0.6666667
#>
#> $bipartiteL2
#> [1] 0.4 0.8 0.2
This package also implements some analysis of dyads.
# dyad census
dyadic_census(A1)
#>      Mutual Asymmetrics       Nulls
#>           7           0           3

# Katz and Powell reciprocity
kp_reciprocity(A1)
#> [1] 1

# Z test of the number of arcs
z_arctest(A1)
#>     z     p
#> 1.789 0.074
We can also check the triad census assuming conditional uniform distribution considering different types of dyads (U|MAN)
triad_uman(A1)
#>    label OBS   EXP   VAR   STD
#> 1    003   0 0.083 0.076 0.276
#> 2    012   0 0.000 0.000 0.000
#> 3    102   2 1.750 0.688 0.829
#> 4   021D   0 0.000 0.000 0.000
#> 5   021U   0 0.000 0.000 0.000
#> 6   021C   0 0.000 0.000 0.000
#> 7   111D   0 0.000 0.000 0.000
#> 8   111U   0 0.000 0.000 0.000
#> 9   030T   0 0.000 0.000 0.000
#> 10  030C   0 0.000 0.000 0.000
#> 11   201   5 5.250 1.688 1.299
#> 12  120D   0 0.000 0.000 0.000
#> 13  120U   0 0.000 0.000 0.000
#> 14  120C   0 0.000 0.000 0.000
#> 15   210   0 0.000 0.000 0.000
#> 16   300   3 2.917 0.410 0.640
Code of conduct
Please note that this project is released with a Contributor Code of Conduct. By participating in this project you agree to abide by its terms.
To-do list
# library(todor)
# todor::todor_package(c("TODO", "FIXME"))