mregions
Marine Regions Data from 'Marineregions.org'
Tools to get marine regions data from < https://www.marineregions.org/>. Includes tools to get region metadata, as well as data in 'GeoJSON' format, as well as Shape files. Use cases include using data downstream to visualize 'geospatial' data by marine region, mapping variation among different regions, and more.
mregions


mregions - Get data from https://www.marineregions.org
Some data comes from the Flanders Marine Institute (VLIZ) geoserver
mregions is useful to a wide diversity of R users because you get
access to all of the data MarineRegions has, which can help in a variety
of use cases:
- Visualize marine regions alone
- Visualize marine regions with associated data paired with analysis
- Use marine region geospatial boundaries to query data providers (e.g., OBIS (https://www.obis.org))
- Geocode - get geolocation data from place names
- Reverse Geocode - get place names from geolocation data
Install
install.packages("mregions")
Development version
devtools::install_github("ropensci/mregions")
library("mregions")
GeoJSON
Get region
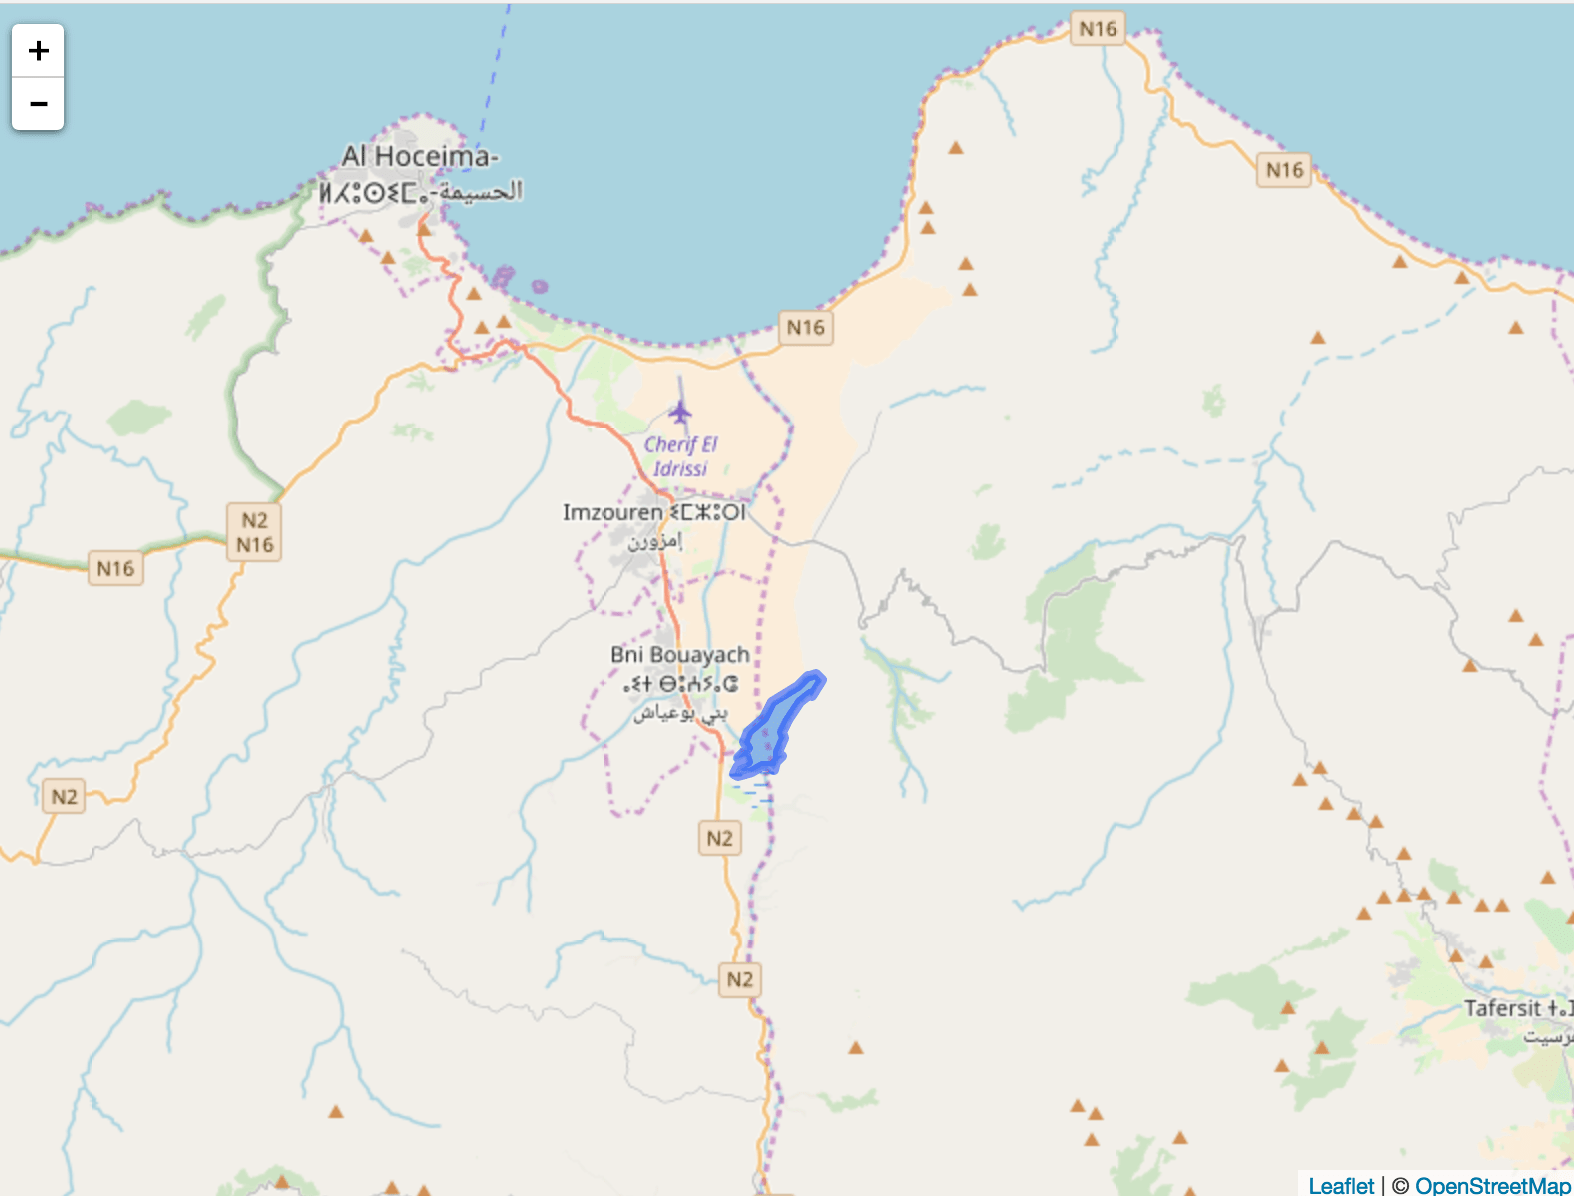
res1 <- mr_geojson(key = "Morocco:dam")
Get helper library
install.packages("leaflet")
Plot data
library('leaflet')
leaflet() %>%
  addProviderTiles(provider = 'OpenStreetMap') %>%
  addGeoJSON(geojson = res1$features) %>%
  setView(-3.9, 35, zoom = 10)
Shape
Get region
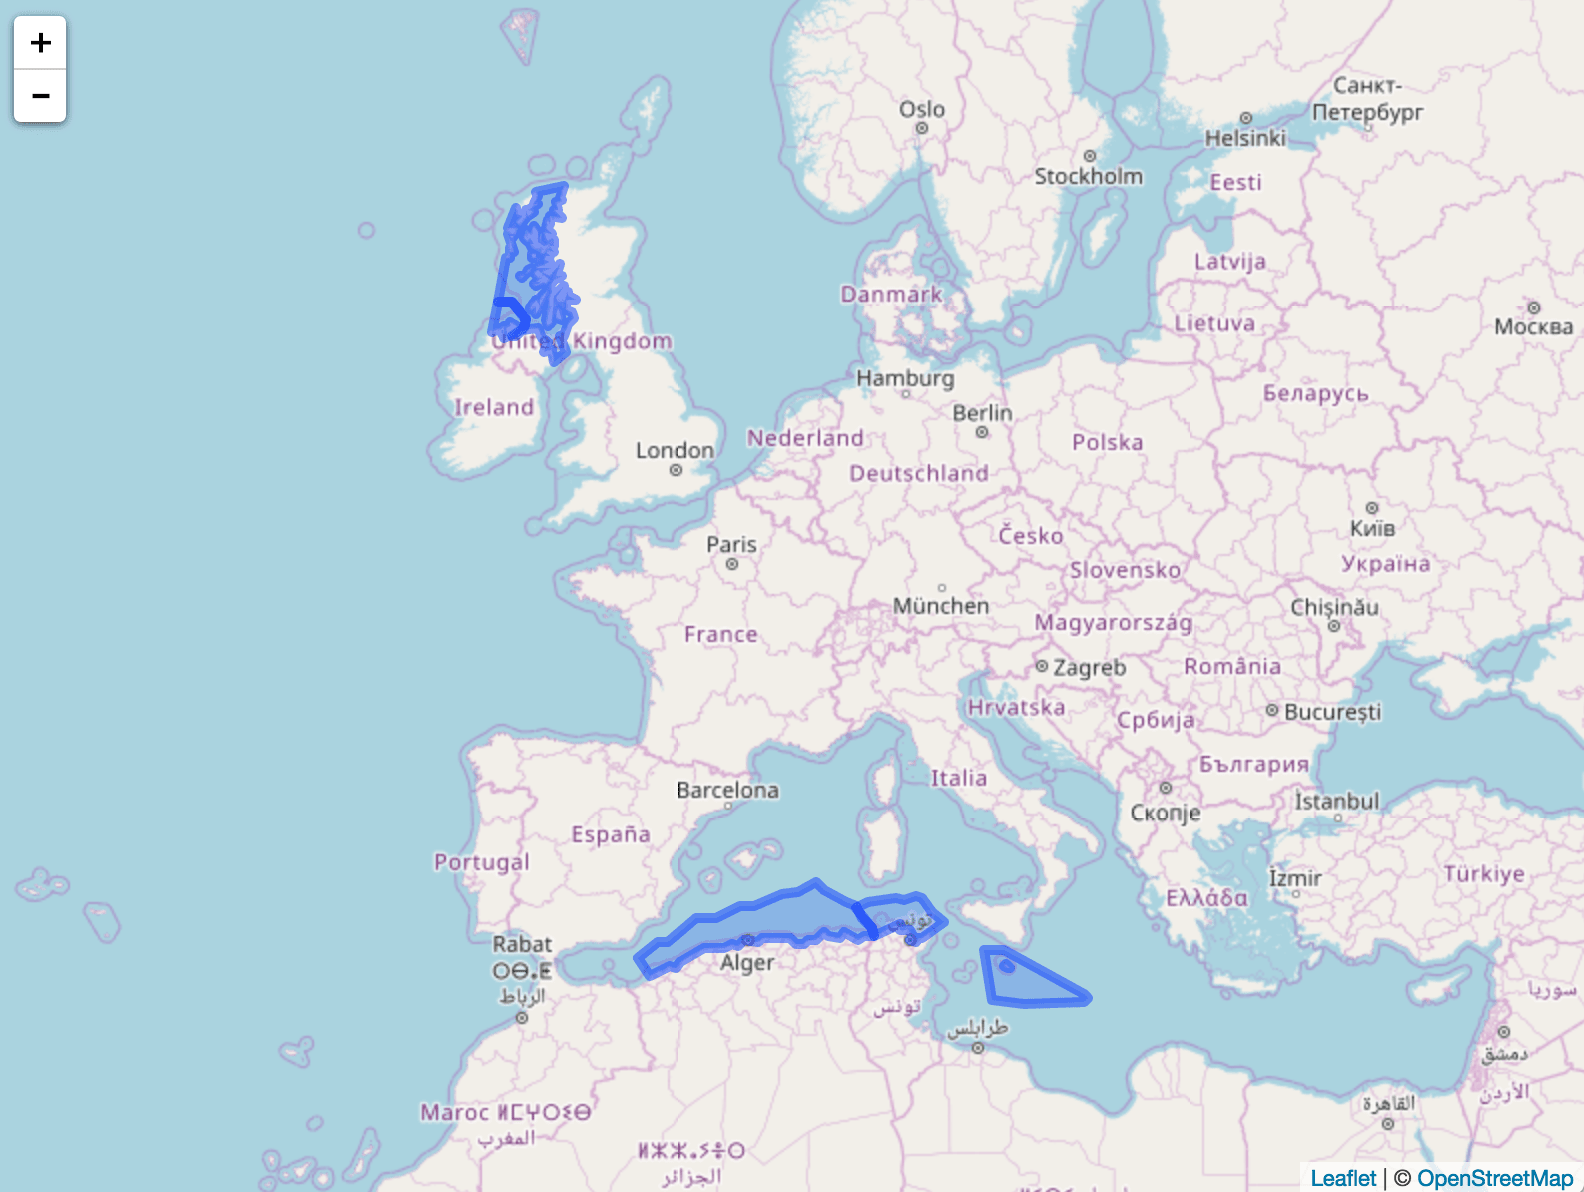
res2 <- mr_shp(key = "MarineRegions:eez_iho_union_v2", maxFeatures = 5)
Get helper library
install.packages("leaflet")
Plot data
library('leaflet')
leaflet() %>%
  addProviderTiles(provider = 'OpenStreetMap') %>%
  addPolygons(data = res2)
Convert to WKT
From geojson
res3 <- mr_geojson(key = "Morocco:dam")
mr_as_wkt(res3, fmt = 5)

#> [1] "MULTIPOLYGON (((41.573732 -1.659444, 45.891882 ... cutoff
From shp object (SpatialPolygonsDataFrame) or file, both work
mr_as_wkt(mr_shp(key = "MarineRegions:eez_iho_union_v2"))

#> [1] "GEOMETRYCOLLECTION (POLYGON ((-7.25 ... cutoff
Contributors
- Scott Chamberlain
- Francois Michonneau
- Pieter Provoost
- Michael Sumner
- Lennert Schepers
- Salvador Fernandez
Meta
- Please report any issues or bugs.
- License: MIT
- Get citation information for
mregionsin R doingcitation(package = 'mregions') - Please note that this project is released with a Contributor Code of Conduct. By participating in this project you agree to abide by its terms.
