metalite.table1
Interactive Table of Descriptive Statistics in HTML
Create an interactive table of descriptive statistics in HTML. This table is typically used for exploratory analysis in a clinical study (referred to as 'Table 1').
metalite.table1

Overview
A table for descriptive statistics is widely used
in medical research and typically be the first table (i.e. table1)
for a manuscript.
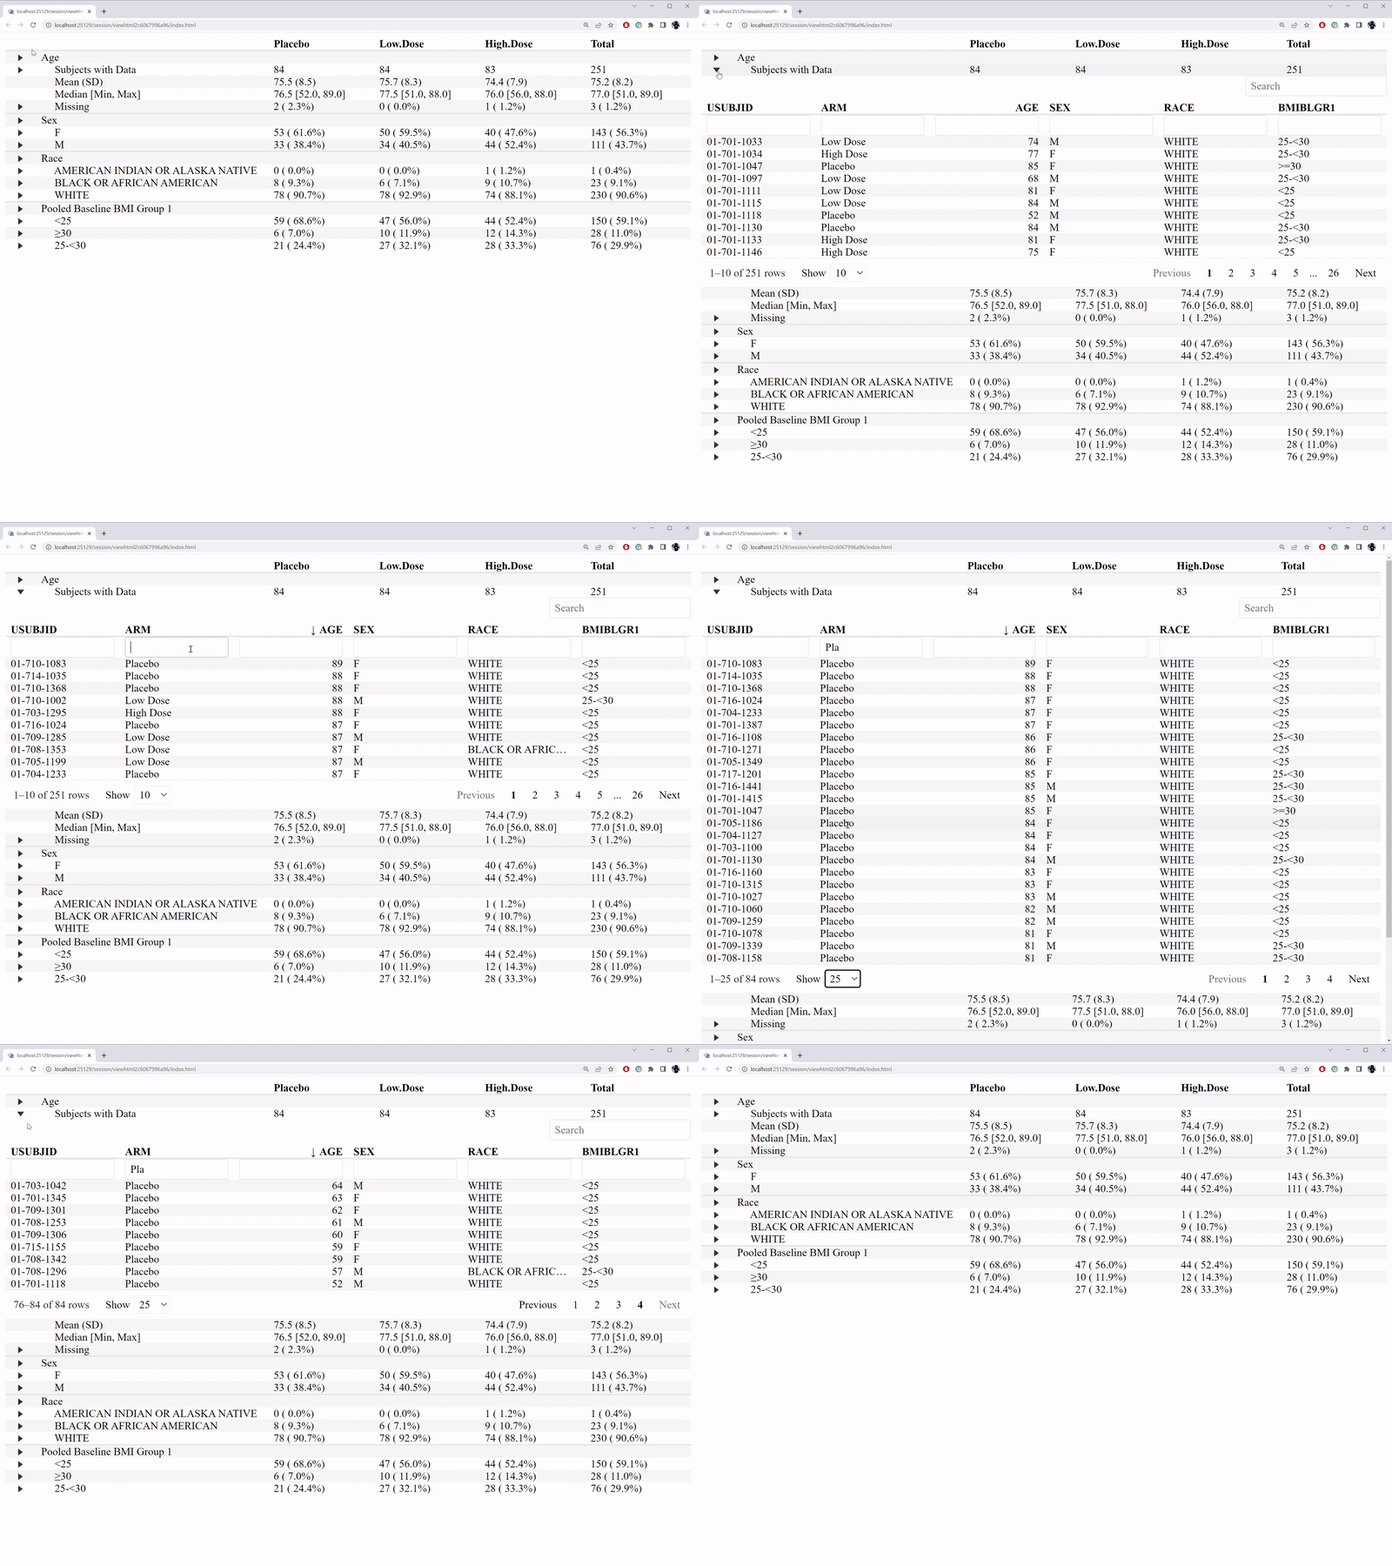
The metalite.table1 provide an interactive table1 to
enhance the communication between statisticians and clinicians.
For use case in clinical trials, Chapter 4 of the R for clinical study reports and submission contains more details.
There are other R packages to create the table1:
Example:
library(metalite.table1)
metalite_table1(~ AGE + SEX + RACE + BMIBLGR1 | ARM, data = r2rtf::r2rtf_adsl, id = "USUBJID")
Installation
You can install the package via CRAN:
install.packages("metalite.table1")
Or, install from GitHub:
remotes::install_github("elong0527/metalite.table1")
Highlighted features
- Drill down listings
- Embedded histogram