mapindia
Plot Map of the Indian Subcontinent
Get map data frames for the Indian subcontinent with different region levels (e.g., district, state). The package also offers convenience functions for plotting choropleths, visualizing spatial data, and handling state/district codes.
mapindia


The goal of mapindia is to simplify mapping of the Indian subcontinent. It has convenient functions for plotting choropleths, visualizing spatial data, and handling state/district codes.
Note: The 3-digit district codes were merged with the 2-digit state codes to create a 5-digit district code.
Installation
To install mapindia from CRAN:
install.packages("mapindia")
You can install the development version of mapindia from GitHub with:
# install.packages("pak")
pak::pak("shubhamdutta26/mapindia")
Usage
library(mapindia)
Example
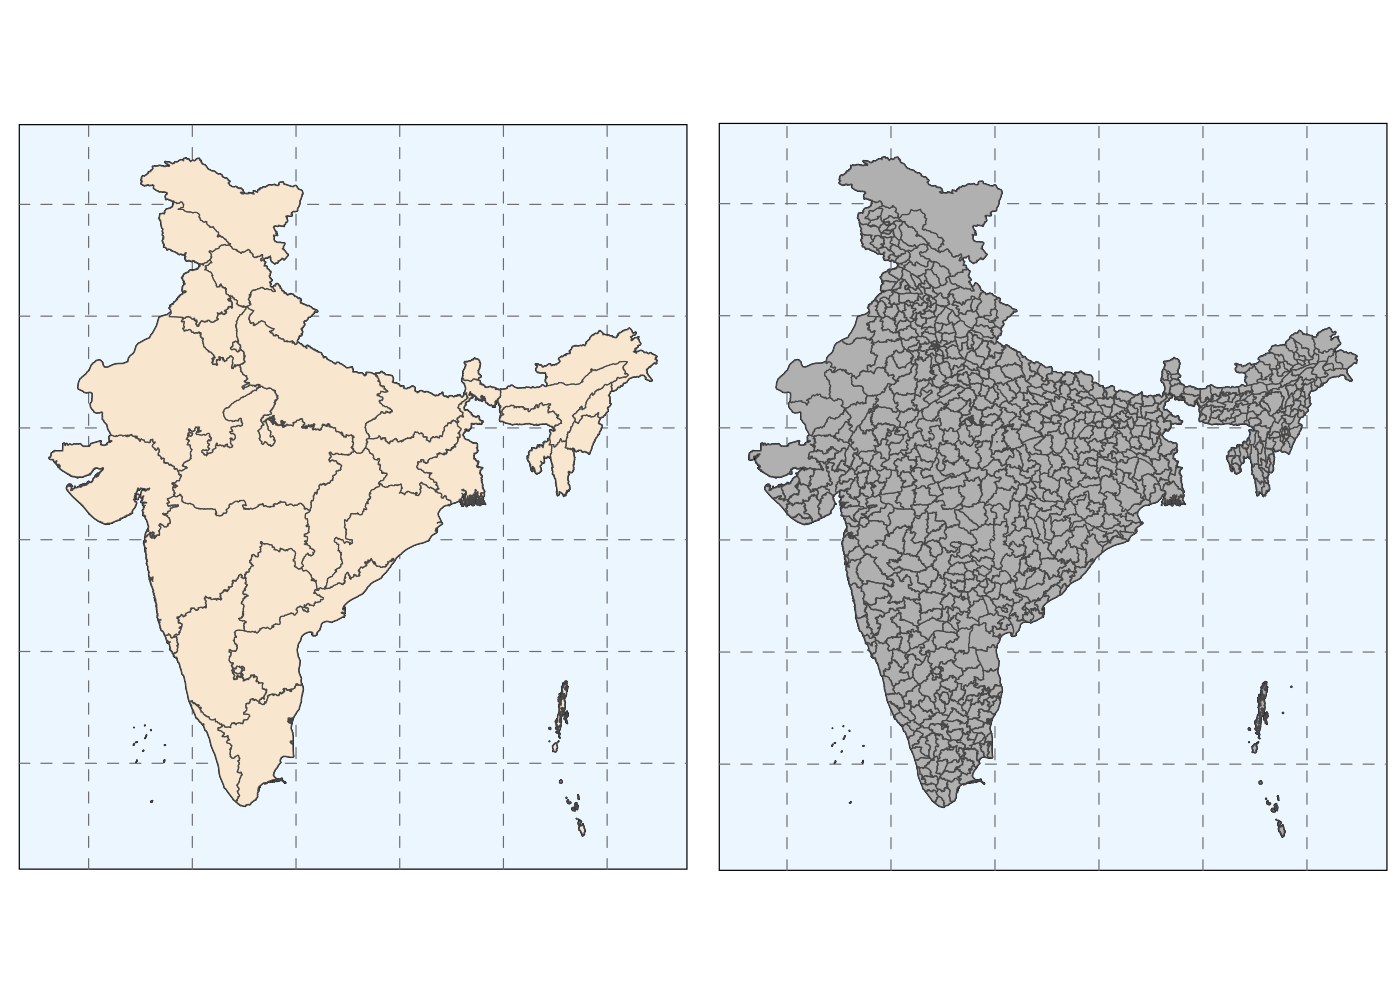
Plot basic maps of the Indian subcontinent with states and districts:
library(mapindia)
library(ggplot2)
library(cowplot)

states <- plot_india("states") +
  geom_sf(fill= "antiquewhite") +
  theme(panel.grid.major =
          element_line(color = gray(.5), linetype = "dashed", linewidth = 0.2),
        panel.background = element_rect(fill = "aliceblue"))

districts <- plot_india("districts") +
  geom_sf(fill= "gray") +
  theme(panel.grid.major =
          element_line(color = gray(.5), linetype = "dashed", linewidth = 0.2),
        panel.background = element_rect(fill = "aliceblue"))

cowplot::plot_grid(states, districts, nrow = 1)
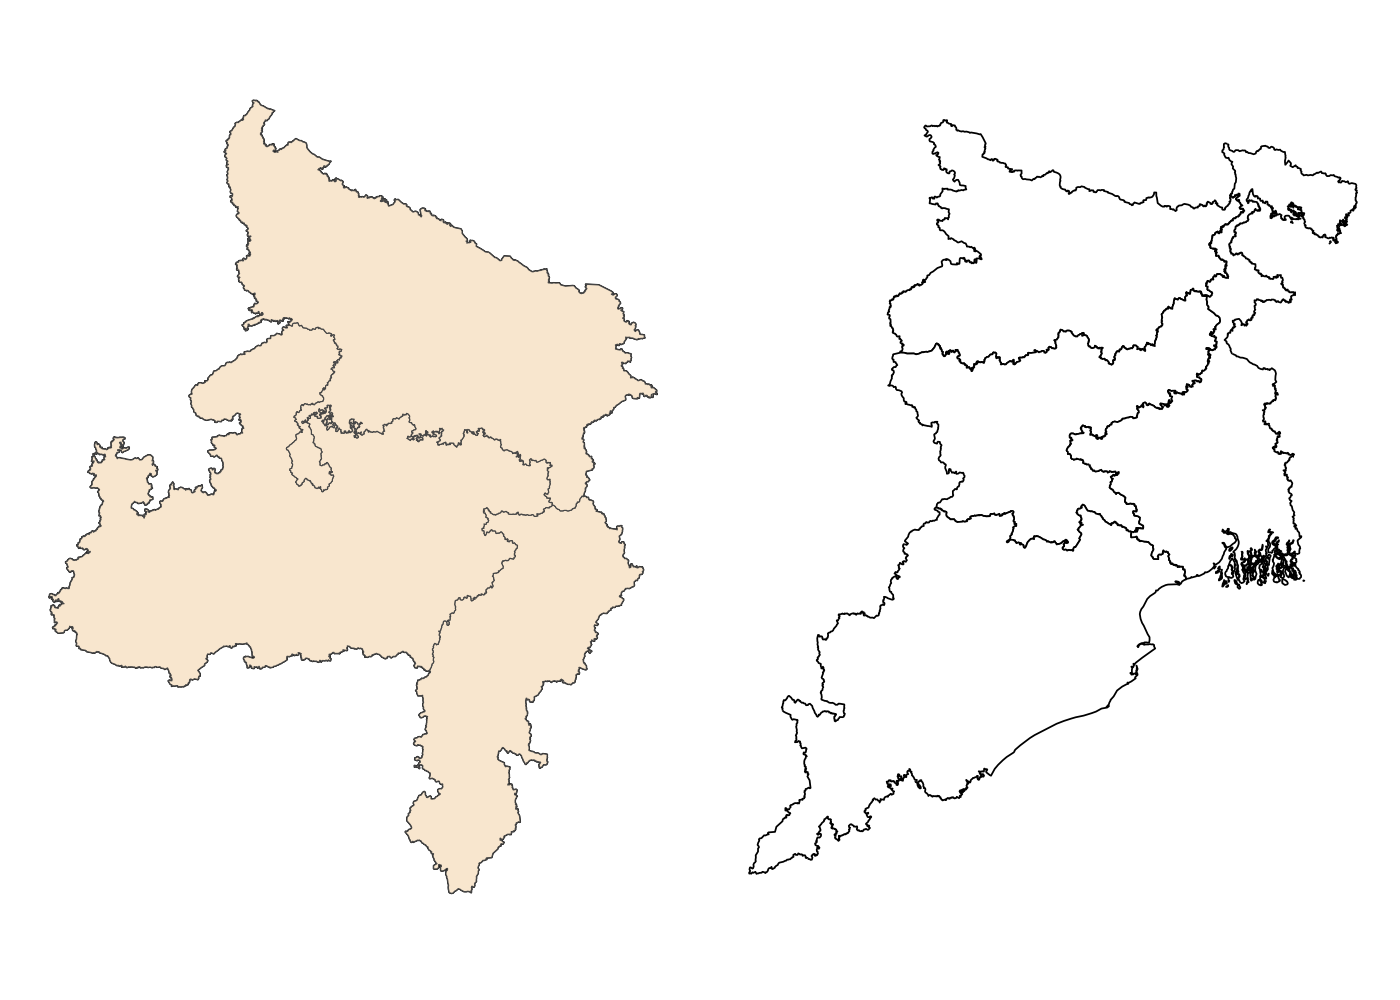
Visualize zones such as the Central or Eastern Zonal Councils:
central <- plot_india("states", include = .central, exclude = "UK", labels = TRUE) +
  geom_sf(fill= "antiquewhite")

east <- plot_india("states", include = .east, labels = FALSE)

cowplot::plot_grid(central, east, nrow = 1)
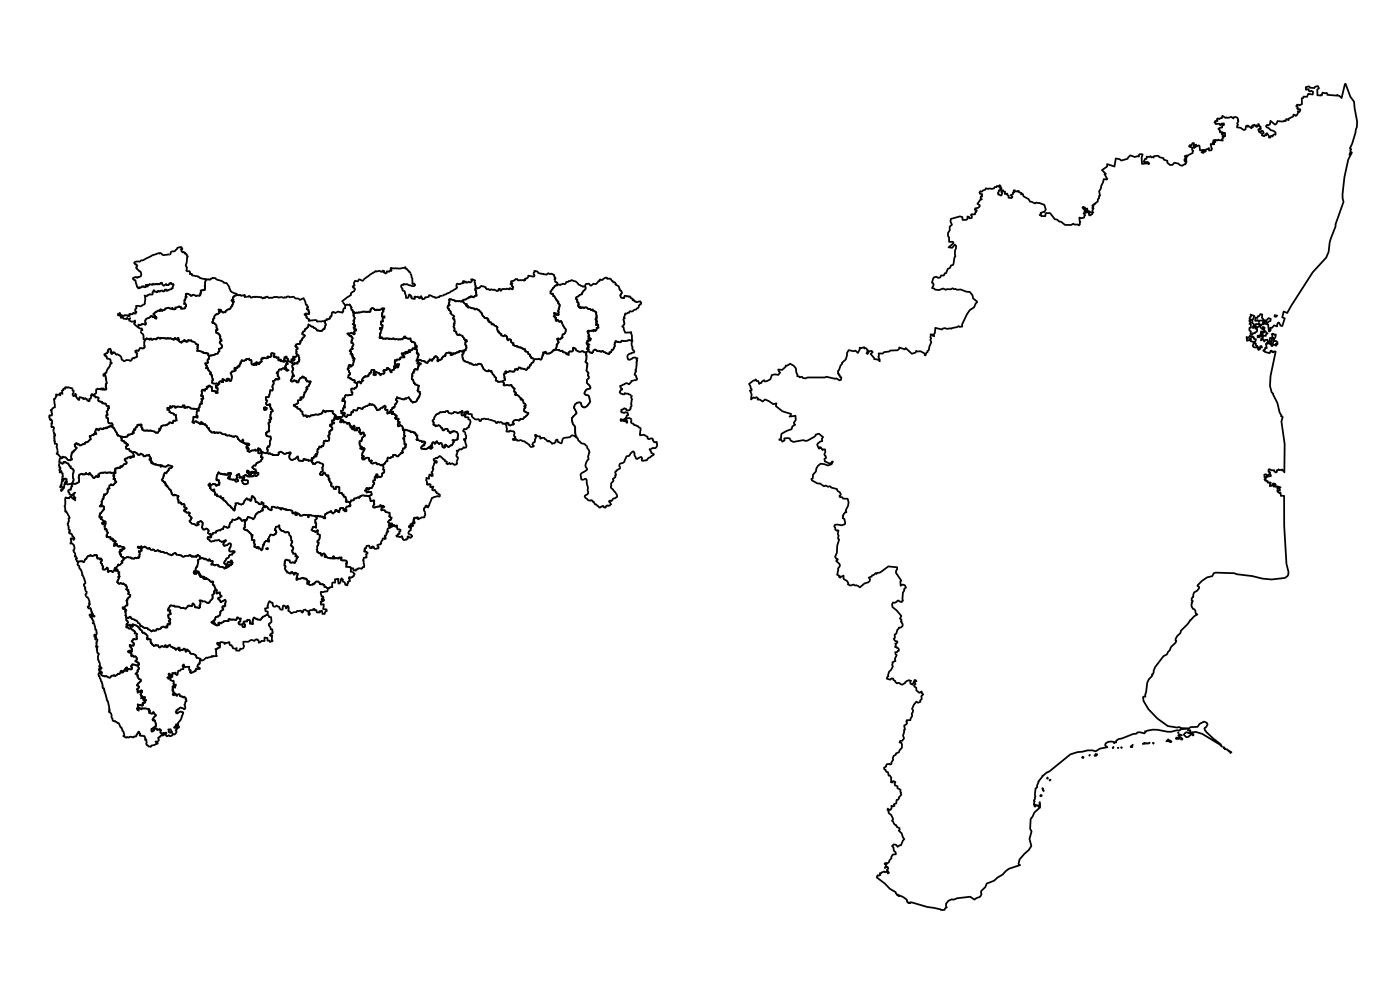
Visualize individual states such as the West Bengal or Tamil Nadu:
mh <- plot_india("districts", include = "MH")

tn <- plot_india("state", include = "Tamil Nadu", labels = FALSE)

cowplot::plot_grid(mh, tn, nrow = 1)
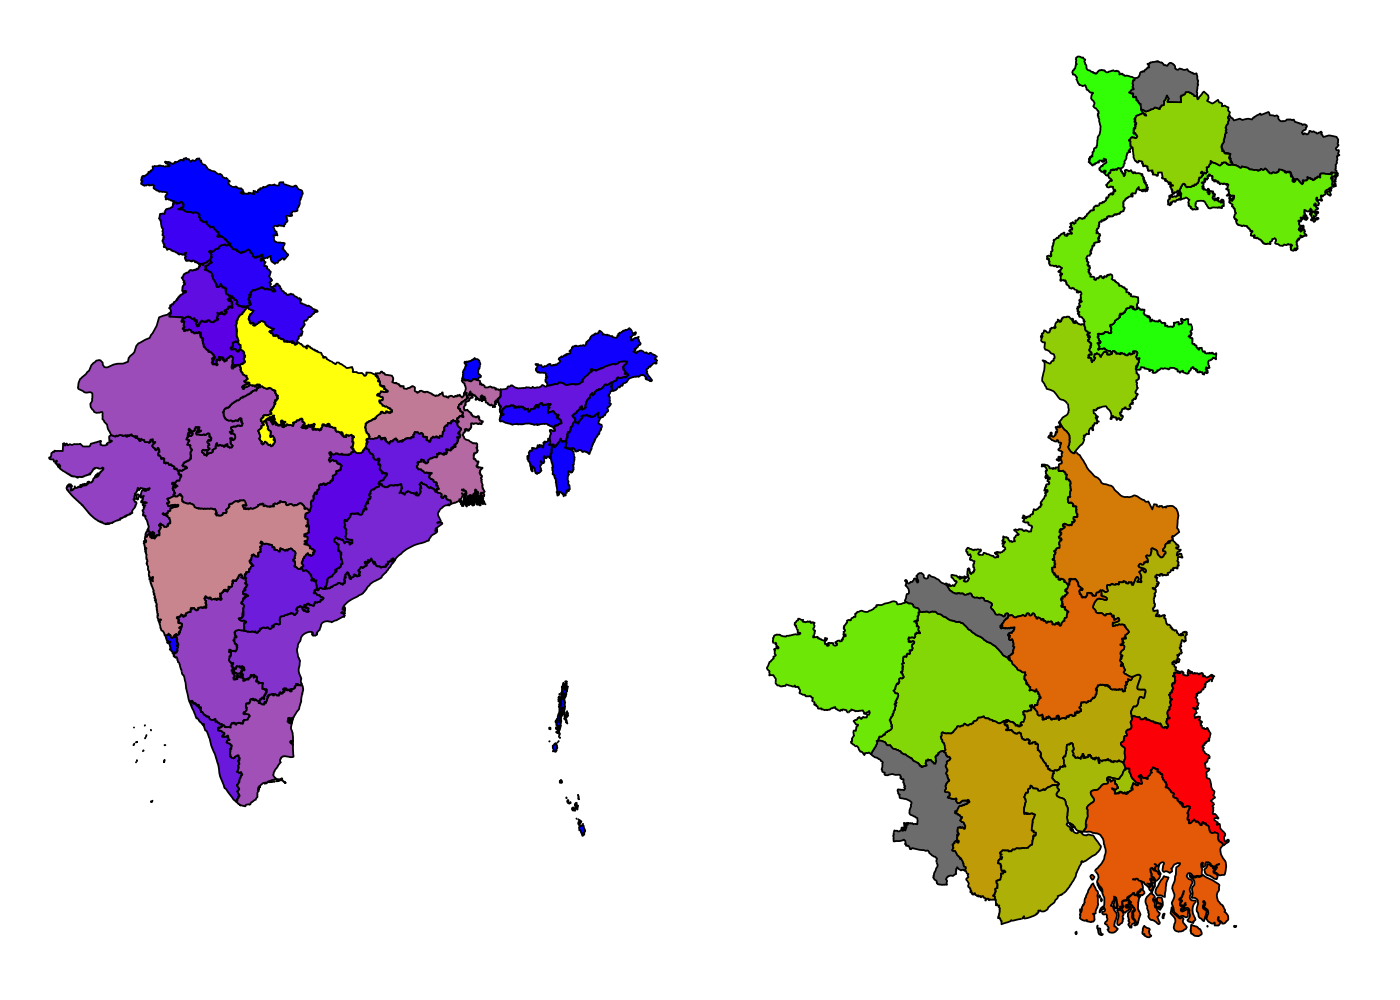
Use your data for visualizations as well:
statepop2011 <- plot_india("states", data = statepop, values = "pop_2011") +
  scale_fill_continuous(low = "blue", high = "yellow", guide = "none")

wbpop2011 <- plot_india("districts", data = wb_2011, values = "pop_2011", include = "WB") +
  scale_fill_continuous(low = "green", high = "red", guide = "none")

cowplot::plot_grid(statepop2011, wbpop2011, nrow = 1)