lt
Lightweight Tables via JSON Specs and JavaScript
A lightweight grammar of tables. Build a table by declaring a JSON spec (titles, spanners, row groups, footnotes, formatting functions, etc.); a tiny vanilla JavaScript runtime builds the HTML table from the spec on page load. Cells can hold inline plots (error bars, dot plots, mini line and bar charts) drawn as SVG in the browser from the numbers alone. Tables can optionally be made interactive (sorting, searching, filtering, pagination, column hiding, expandable row detail, and CSV download) via a separate extension loaded only when requested. No 'sass', no 'V8', no 'htmlwidgets' — just base R and 'xfun' ('htmltools' is used only for the optional Shiny binding and for embedding tables in other HTML output).
LT


Lightweight tables for R, inspired by gt.
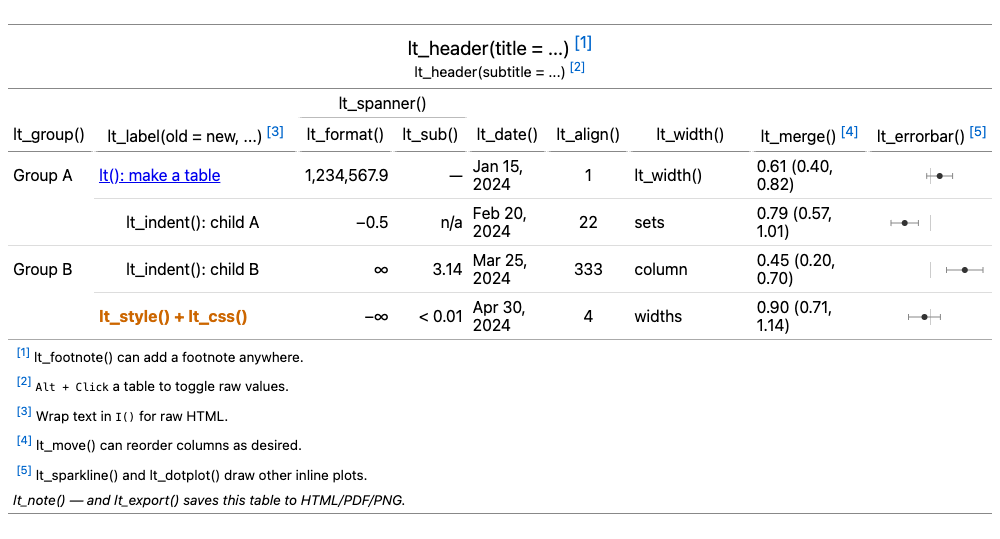
lt provides a small grammar of tables that covers the structure most reports need — titles, column spanners, row groups, footnotes, and number formatting — without the heavy dependency stack. It targets HTML only (no LaTeX or RTF), which keeps the implementation minimal: the entire runtime is a single, tiny vanilla-JS file (see the size badge above).
Tables can also hold inline plots (lt_errorbar(), lt_sparkline(),
lt_dotplot()) and be made interactive — sorting, searching, per-column
filtering, pagination, resizable columns, column hiding, expandable row detail,
and CSV download — with lt_interactive().
Both inline plots and interactivity live in separate extensions on top of the
core runtime (lt-plot.js and lt-interactive.js), each loaded only for the
tables that use it. A plain static table pulls in neither, so it stays as light
as ever.
Installation
# CRAN version
install.packages("lt")

# development version
install.packages("lt", repos = "https://yihui.r-universe.dev")
You may also play with the package at https://pkg.yihui.org/lt/playground/ without installing it.
Functions
lt() creates a table object from a data frame. The lt_*() functions build
on it via the pipe. See https://pkg.yihui.org/lt/examples/01-lt#sec:cheatsheet
for a "cheat table" as an overview of these functions.
Structure
lt_header()— title and optional subtitle above the table.lt_spanner()— column-spanner label spanning a group of columns; or auto-infer spanners from column name prefixes.lt_group()— partition rows into labeled groups (rowspan or full-width separator style), either by column values or manual row indices.
Content & labels
lt_label()— override column header labels.lt_footnote()— attach a numbered footnote to any region (title, subtitle, column, spanner, group, or body cells).lt_note()— append a plain unnumbered note below the table.lt_html()— render selected columns' cells as raw HTML instead of escaping them. For raw HTML in text (title, labels, footnotes, ...), wrap the text inI()in the corresponding function.
Formatting
lt_format()— numeric formatting: decimal places, thousand separators, prefix/suffix, percentage, scientific notation, etc.lt_date()— date/datetime formatting using the browser locale.lt_sub()— substitute specific values (e.g., replace0with"—"orNAwith"n/a").lt_merge()— merge several columns into one using a sprintf-style pattern.lt_indent()— indent selected rows (useful for hierarchical row labels).
Inline plots
Drawn as SVG in the browser from the numbers alone — nothing but the data travels to the client, and an interactive table draws only the visible rows.
lt_errorbar()— a point estimate with lower/upper bounds on a scale shared across rows (a forest plot of effect sizes); several series can stack in one cell, with a colored legend and optional reference line and axis.lt_sparkline()— a per-row line or bar chart, from a list-column or several numeric columns read across the row.lt_dotplot()— one dot per column on a shared scale, optionally colored with a legend and staggered onto separate tracks so near-equal values do not overlap.
By default a plot draws into the first value column's cells; lt_errorbar() and
lt_dotplot() also take into= to name a dedicated column to draw into
(created when it does not exist), keeping the value columns visible as text.
Appearance
lt_align()— set column alignment (left / center / right).lt_width()— set column widths.lt_style()— apply CSS classes or inline styles to cells, conditionally or unconditionally.lt_css()— attach an external CSS file or URL to the table.lt_wrap()— set HTML attributes (class,style,id, ...) on the table's container, e.g. to scope custom CSS to one table or give it a fixed width.
Column order & visibility
lt_move()— reorder columns.lt_hide()— hide columns from the rendered table (still shipped in the data, so an interactive row detail can surface them).
Interactivity
lt_interactive()— opt a table into client-side sorting, a search box, per-column filters (text, dropdown, range slider, or checklist), pagination, resizable columns, column hiding, expandable row detail (drill-down), and CSV download of the current view. Features are handled by a small JavaScript extension loaded only for interactive tables.
Export
lt_export()— save a table to a file:.html(optionally baking a static<table>that needs no JavaScript to view),.pdf, or.png(rendered via a headless Chromium browser).
Shiny
lt_output()/render_lt()— Shiny UI and server bindings.
Embedding
lt_spec()— extract a table's render-ready spec (data plus ops), to ship to the browser and render client-side withLT.render().lt_dependency()— thehtmlDependencybundling lt's runtime assets, for embedding lt tables in other HTML output (e.g. an htmlwidget).
Examples
The R code below builds a table spec. Under the hood lt serializes it to a
compact JSON object and ships it to the browser, where a tiny vanilla-JS runtime
renders the <table>.
library(lt)

d = data.frame(
  Group = c("Treatment", "Treatment", "Control", "Control"),
  Endpoint = c("Primary", "Secondary", "Primary", "Secondary"),
  Estimate = c(0.6123, 0.7891, 0.4567, 0.5432),
  CI_Lower = c(0.4012, 0.5678, 0.2345, 0.3210),
  CI_Upper = c(0.8234, 1.0104, 0.6789, 0.7654),
  P_Value = c(0.0012, NA, 0.1234, NA)
)
lt(d) |>
  lt_group(~ Group) |>
  lt_header("Study Results", "Primary and secondary endpoints") |>
  lt_spanner(`95% CI` ~ CI_Lower + CI_Upper) |>
  lt_format(~ Estimate + CI_Lower + CI_Upper, decimals = 3) |>
  lt_sub(~ P_Value, missing = "n/a") |>
  lt_footnote("Two-sided p-value from log-rank test.", "column", ~ P_Value)
The same table can be built directly in JavaScript. Load lt.js once on the
page, then call LT.build() from an inline <script> with the JSON spec:
<link rel="stylesheet" href="https://cdn.jsdelivr.net/npm/@xiee/utils/css/lt.min.css">
<script src="https://cdn.jsdelivr.net/npm/@xiee/utils/js/lt.min.js"></script>
<script>
LT.build({
  "data": {
    "Group":    ["Treatment", "Treatment", "Control", "Control"],
    "Endpoint": ["Primary", "Secondary", "Primary", "Secondary"],
    "Estimate": [0.6123, 0.7891, 0.4567, 0.5432],
    "CI_Lower": [0.4012, 0.5678, 0.2345, 0.3210],
    "CI_Upper": [0.8234, 1.0104, 0.6789, 0.7654],
    "P_Value":  [0.0012, null, 0.1234, null]
  },
  "ops": [
    { "type": "fmt_number", "columns": ["Estimate", "CI_Lower", "CI_Upper"], "decimals": 3 },
    { "type": "sub", "columns": ["P_Value"], "missing": "n/a" }
  ],
  "row_group": ["Group"],
  "header": { "title": "Study Results", "subtitle": "Primary and secondary endpoints" },
  "spanners": [{ "label": "95% CI", "columns": ["CI_Lower", "CI_Upper"] }],
  "footnotes": [{
    "text": "Two-sided p-value from log-rank test.",
    "location": { "type": "column_labels", "columns": ["P_Value"] }
  }]
});
</script>
LT.build() renders the table in place of the calling <script> tag. One
lt.js inclusion handles any number of tables on the page.
You can find more examples at https://pkg.yihui.org/lt/examples.html. If you are coming from gt, see the migration guide at https://pkg.yihui.org/lt/examples/03-gt.html for a function-by-function mapping and notes on where lt differs.
Acknowledgements
This package was written with the help of Claude Code. lt is directly inspired by gt by Rich Iannone and the RStudio/Posit team. The grammar of tables that gt pioneered — layering titles, spanners, footnotes, and formatters onto a data frame — is a great idea; lt aims to provide a minimal re-implementation for contexts where a lighter footprint is preferred.