litReview
Summarizing Graphs for Literature Reviews
Summarizes and visualizes categorical data extracted during literature reviews and evidence syntheses, starting from a data frame with one row per study. Generates publication-ready bar, stacked bar, histogram, waffle, donut, treemap, alluvial, trend, co-occurrence, 'UpSet', tree, and study-by-criteria matrix figures, together with world maps and formatted summary tables. Plot functions return standard 'ggplot2' objects that can be further customized, and an interactive 'Shiny' application is included for building figures without writing code. Aims to help researchers report study characteristics consistently across many publications.
litReview: An R package for plotting literature review results 
litReview provides functions to summarize and visualize categorical
data from literature reviews. All plot functions return standard ggplot
objects you can customize with +.
Installation
Install the released version from CRAN:
install.packages("litReview")
Or the development version from GitHub:
# install.packages("remotes")
remotes::install_github("sonsoleslp/litReview")
Usage
library(litReview)
data(studies)
Bar chart
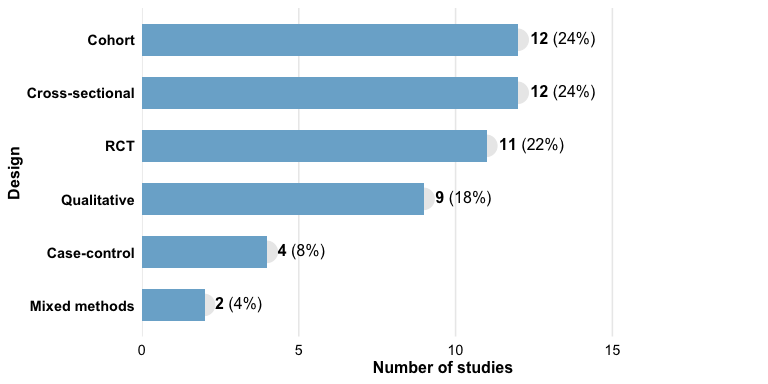
reviewBar(studies, Design)
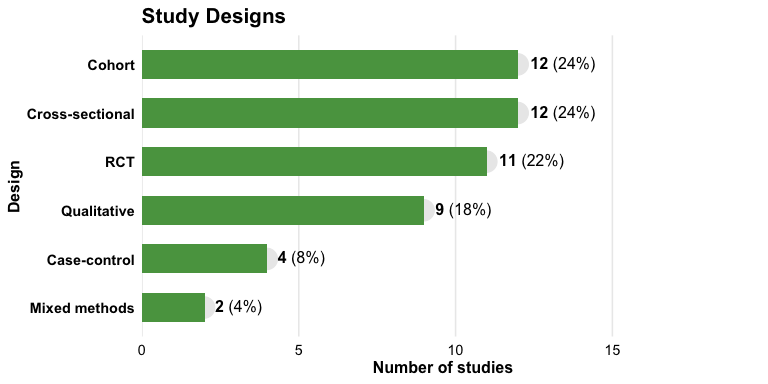
reviewBar(studies, Design, fill = "#59a14f") +
  ggplot2::labs(title = "Study Designs")
Study labels on bars
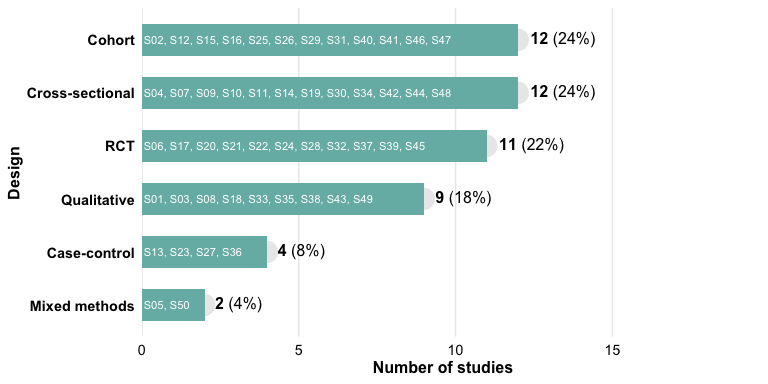
reviewBar(studies, Design, fill = PALETTE[2], studlabs = TRUE)
Stacked bar chart
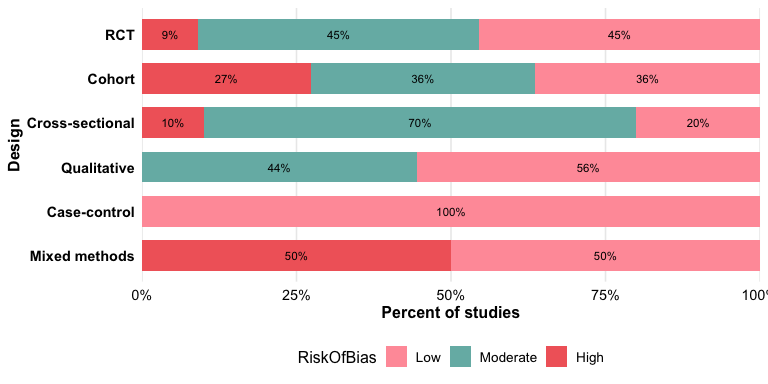
reviewStackedBar() compares the composition of one category across
another. By default each bar is scaled to 100% to compare proportions:
reviewStackedBar(studies, Design, RiskOfBias)
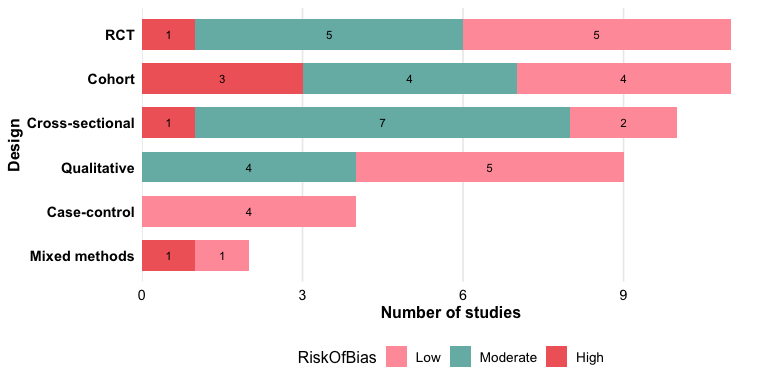
Use position = "stack" for raw counts:
reviewStackedBar(studies, Design, RiskOfBias, position = "stack")
Histogram
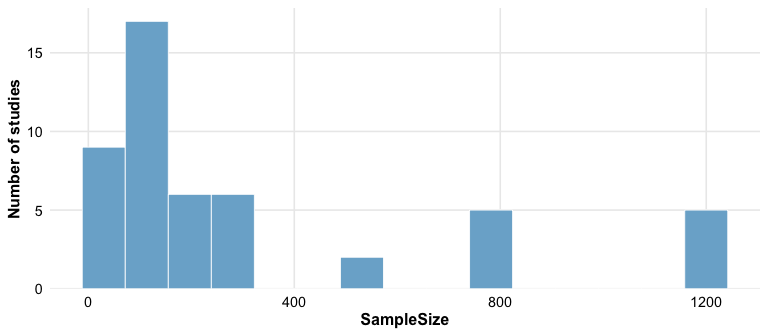
reviewHistogram() bins a numeric column; add fill_by to stack by a
group.
reviewHistogram(studies, SampleSize, bins = 15)
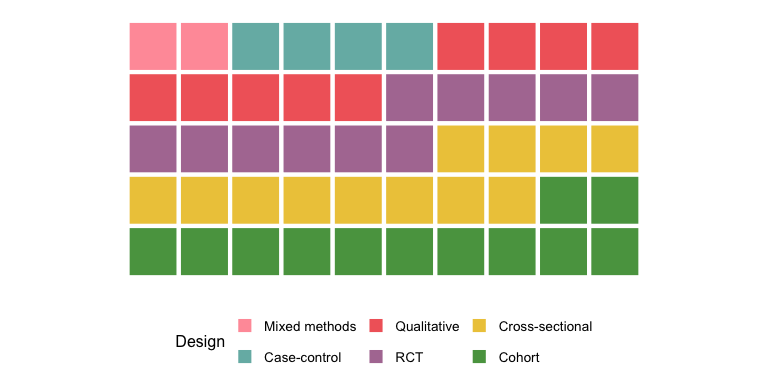
Waffle chart
reviewWaffle(studies, Design, ncol = 10)
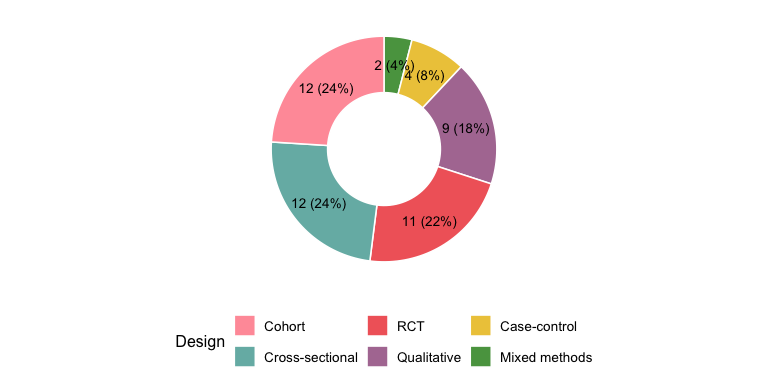
Donut chart
reviewPie(studies, Design)
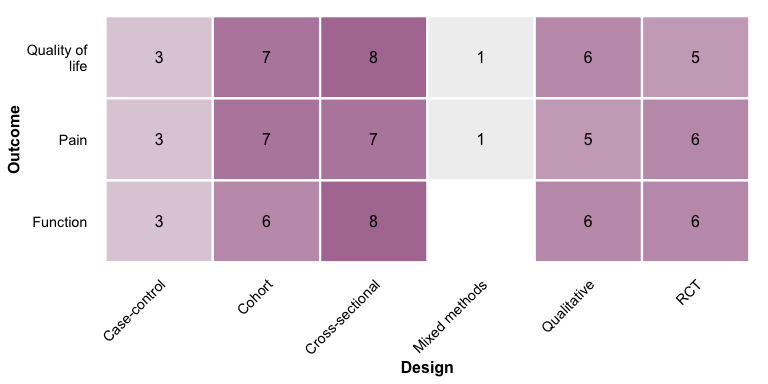
Co-occurrence heatmap
reviewOverlap(studies, Design, Outcome, fill = "#b07aa1")
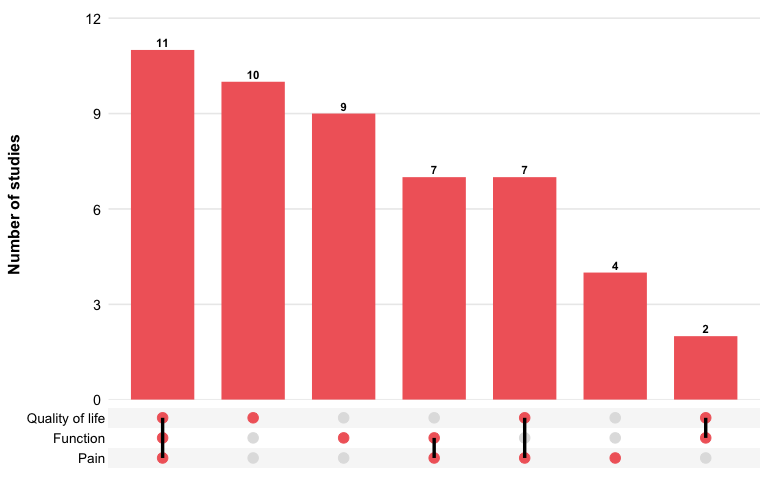
UpSet plot
reviewUpset() shows how the values of a multi-value column co-occur
across studies — a scalable alternative to the pairwise heatmap.
Requires the ggupset package.
reviewUpset(studies, Outcome, fill = "#f16769")
Alluvial plot
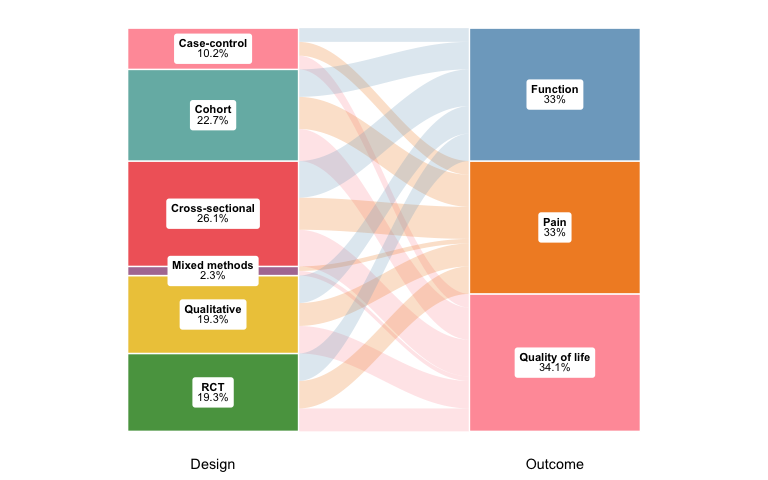
reviewAlluvial(studies, c("Design", "Outcome"), labels = "prop")
Year trend
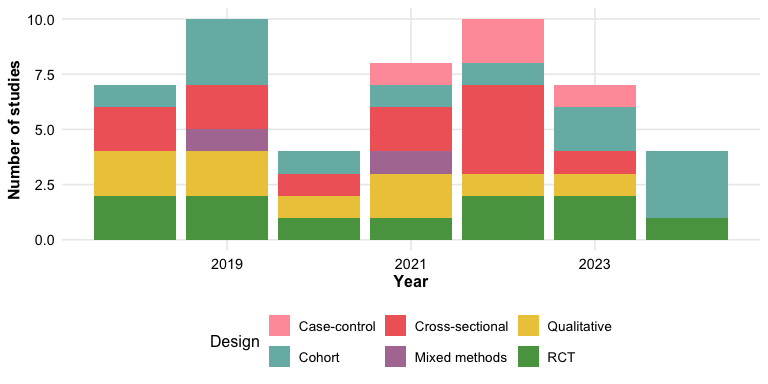
reviewTrend(studies, Design)
World map
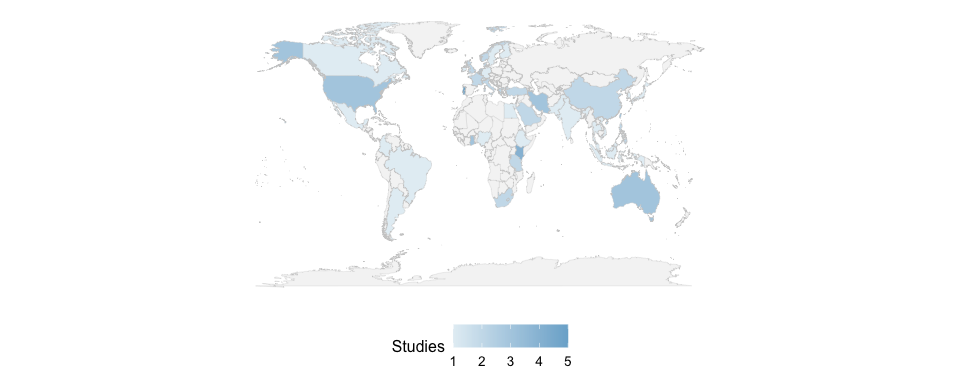
reviewMap(studies)
Treemap
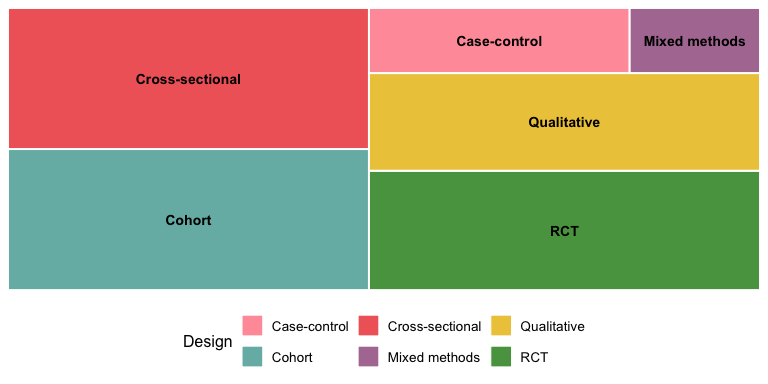
reviewTreemap(studies, Design)
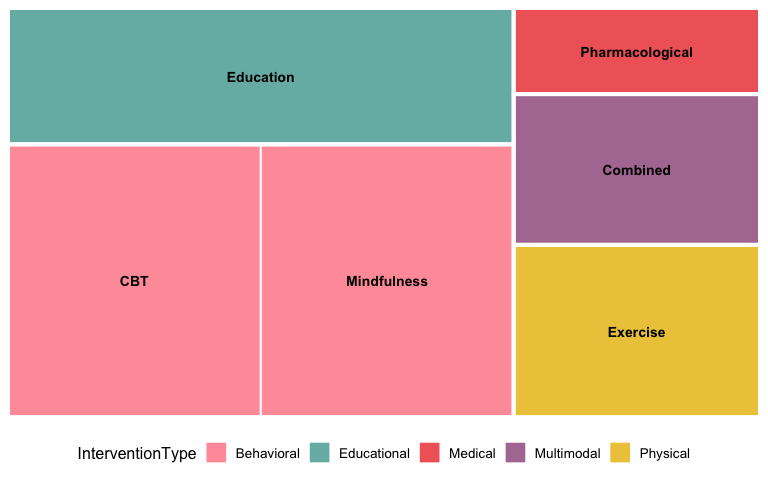
reviewTreemap(studies, Intervention, color_by = InterventionType)
Coding matrix
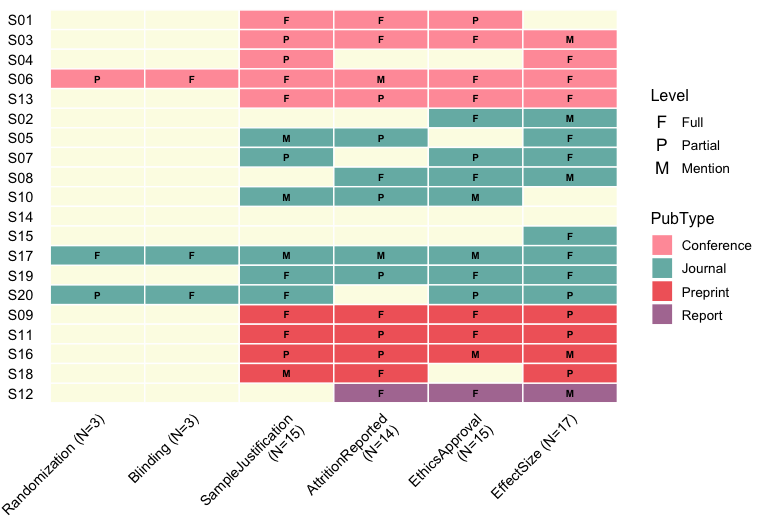
reviewMatrix() shows a study-by-criteria evidence matrix: a tile
wherever a study addresses a criterion, coloured by a study attribute
with the coding level inside.
criteria <- c("Randomization", "Blinding", "SampleJustification",
              "AttritionReported", "EthicsApproval", "EffectSize")
reviewMatrix(studies[1:20, ], criteria, color_by = "PubType",
             levels = c(F = "Full", P = "Partial", M = "Mention"))
Tree diagram
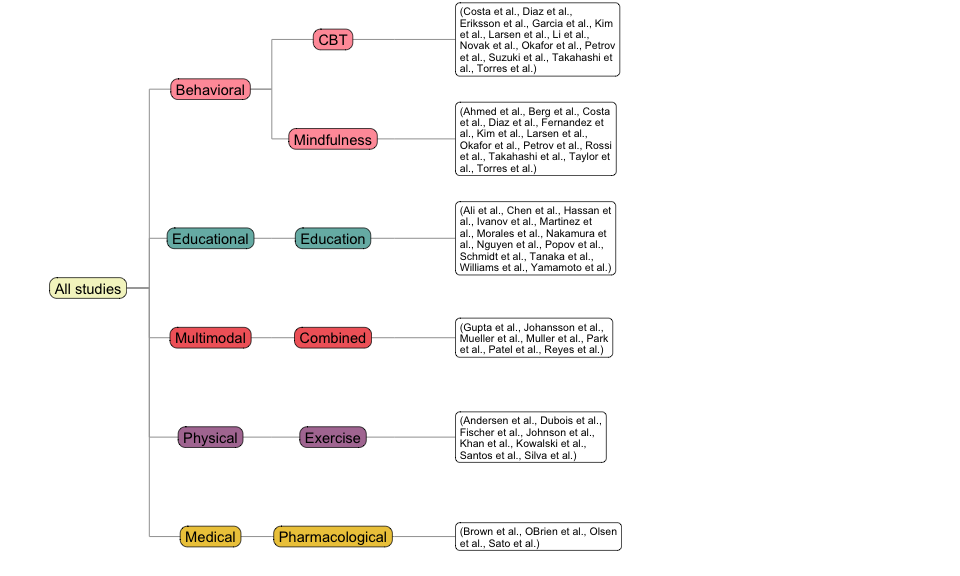
reviewTree() draws a left-to-right hierarchy from columns given in
order, listing the studies at each leaf.
reviewTree(studies, c("InterventionType", "Intervention"), study_id = Author)
Summary table
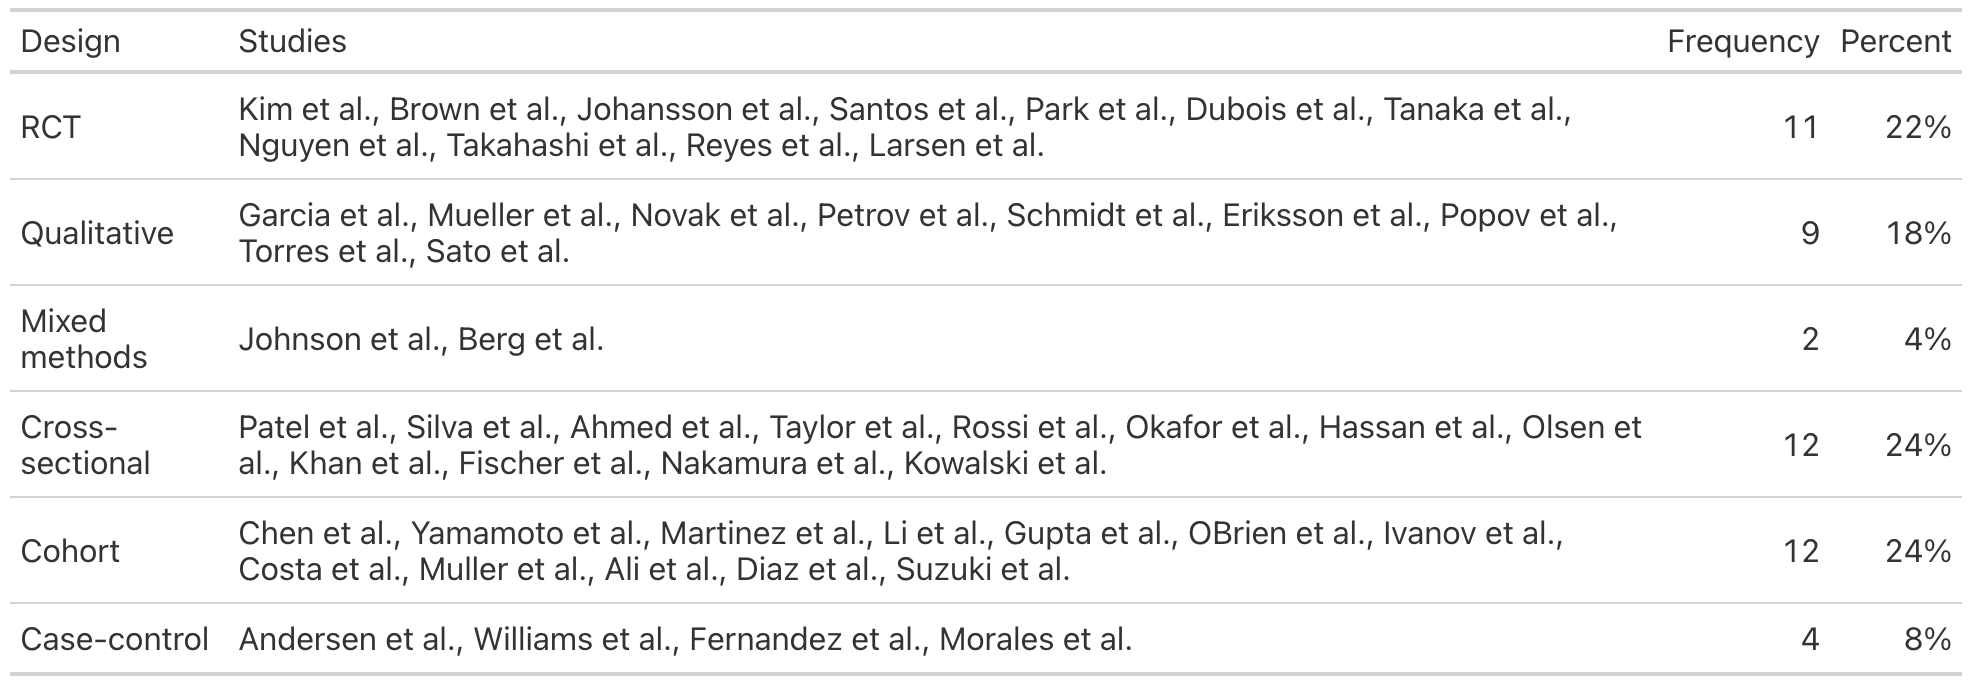
reviewTable(studies, Design, study_id = "Author")
Handling missing data
df_na <- data.frame(
  StudyID = paste0("S", 1:8),
  Design  = c("RCT", "Cohort", NA, "RCT", "Case-control", NA, "RCT", "Cohort"),
  stringsAsFactors = FALSE
)
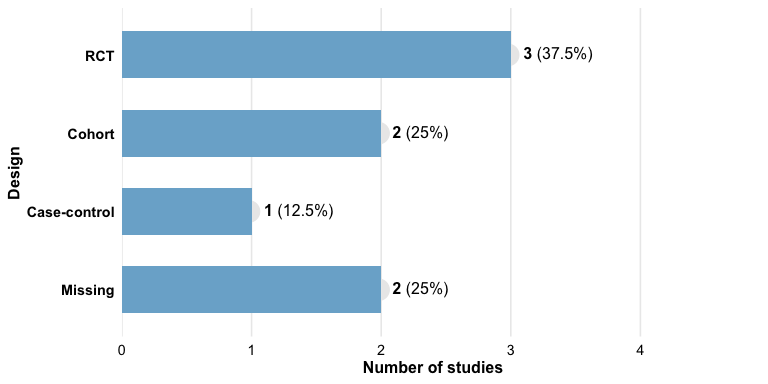
reviewBar(df_na, Design, na.rm = FALSE, na_label = "Missing", na_last = TRUE)