lineupjs
'HTMLWidget' Wrapper of 'LineUp' for Visual Analysis of Multi-Attribute Rankings
'LineUp' is an interactive technique designed to create, visualize and explore rankings of items based on a set of heterogeneous attributes. This is a 'htmlwidget' wrapper around the JavaScript library 'LineUp.js'. It is designed to be used in 'R Shiny' apps and 'R Markddown' files. Due to an outdated 'webkit' version of 'RStudio' it won't work in the integrated viewer.
LineUp.js as HTMLWidget


LineUp is an interactive technique designed to create, visualize and explore rankings of items based on a set of heterogeneous attributes. This is a HTMLWidget wrapper around the JavaScript library LineUp.js. Details about the LineUp visualization technique can be found at https://jku-vds-lab.at/tools/lineup/.
It can be used within standalone R Shiny apps or R Markdown files. Crosstalk is supported for synching selections and filtering among widgets.
Installation
install.packages('lineupjs')
library(lineupjs)
Examples
lineup(mtcars)
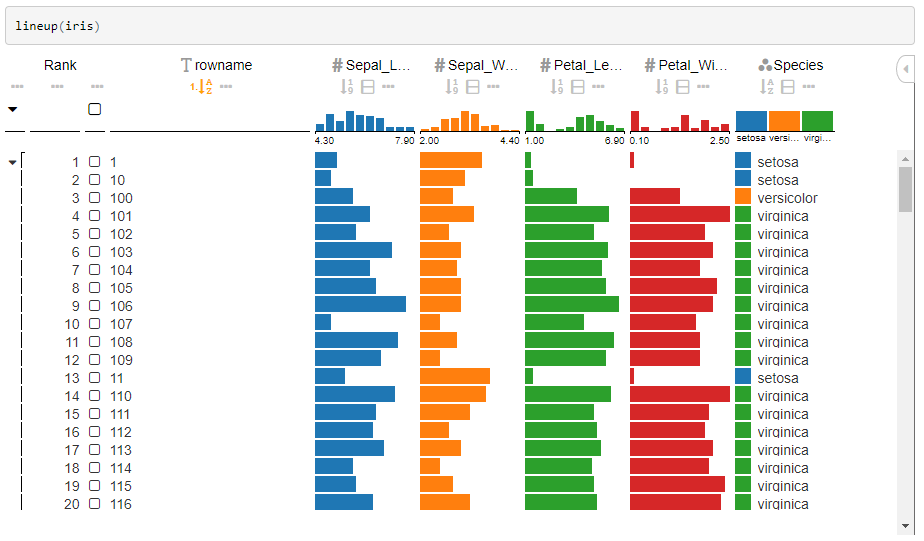
lineup(iris)
Advanced Example
lineup(iris,
  ranking=lineupRanking(columns=c('_*', '*', 'impose'),
                        sortBy=c('Sepal_Length:desc'), groupBy=c('Species'),
                        impose=list(type='impose', column='Sepal_Length', categoricalColumn='Species')))

Crosstalk Example
devtools::install_github("jcheng5/d3scatter")
library(d3scatter)
library(crosstalk)

shared_iris = SharedData$new(iris)

d3scatter(shared_iris, ~Petal.Length, ~Petal.Width, ~Species, width="100%")
lineup(shared_iris, width="100%")

Shiny Example
library(shiny)
library(crosstalk)
library(lineupjs)
library(d3scatter)

# Define UI for application that draws a histogram
ui <- fluidPage(
  titlePanel("LineUp Shiny Example"),

  fluidRow(
    column(5, d3scatterOutput("scatter1")),
    column(7, lineupOutput("lineup1"))
  )
)

# Define server logic required to draw a histogram
server <- function(input, output) {
  shared_iris <- SharedData$new(iris)

  output$scatter1 <- renderD3scatter({
    d3scatter(shared_iris, ~Petal.Length, ~Petal.Width, ~Species, width = "100%")
  })

  output$lineup1 <- renderLineup({
    lineup(shared_iris, width = "100%")
  })
}

# Run the application
shinyApp(ui = ui, server = server)
Hint:
In case you see scrollbars in each cell it is because of the font the cells are too narrow, you can specify a larger row height using
lineup(iris, options=list(rowHeight=20))
Authors
- Samuel Gratzl (@sgratzl)
- Datavisyn GmbH (@datavisyn)