hydroscoper
Interface to the Greek National Data Bank for Hydrometeorological Information
R interface to the Greek National Data Bank for Hydrological and Meteorological Information. It covers Hydroscope's data sources and provides functions to transliterate, translate and download them into tidy dataframes.
hydroscoper








hydroscoper is an R interface to the Greek National Data Bank for
Hydrological and Meteorological Information, Hydroscope. For more
details checkout the package’s
website and the vignettes:
- An introduction to
hydroscoperwith details about the Hydroscope project and the package. - Using
hydroscoper’s data sets with a simple example of how to use the package’s internal data sets.
Installation
Install the stable release from CRAN with:
install.packages("hydroscoper")
You can install the development version from GitHub with:
# install.packages("devtools")
devtools::install_github("ropensci/hydroscoper")
Using hydroscoper
The functions that are provided by hydroscoper are:
get_stations, get_timeseries, ..., etc.family functions, to retrieve tibbles with Hydroscope’s data for a given data source.get_data, to retrieve a tibble with time series’ values.hydro_coords, to convert Hydroscope’s points’ raw format to a tibble.hydro_translateto translate various terms and names from Greek to English.
The data sets that are provided by hydroscoper are:
stationsa tibble with stations’ data from Hydroscope.timeseriesa tibble with time series’ data from Hydroscope.greece_bordersa tibble with the borders of Greece.
Example
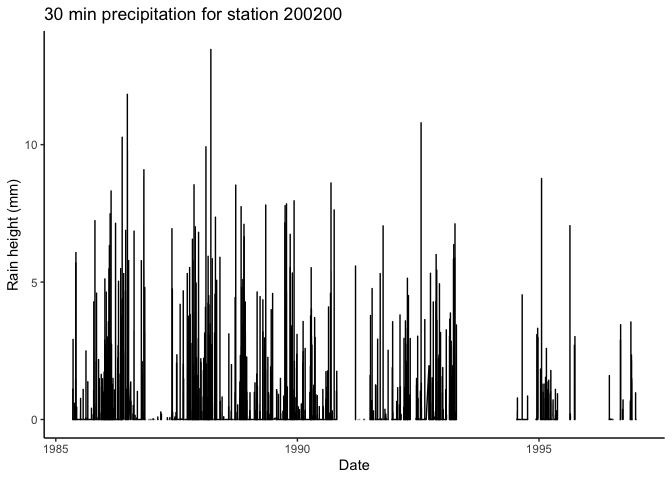
This is a minimal example which shows how to get the station’s 200200 precipitation time series 56 from the kyy sub-domain.
Load libraries and get data:
library(hydroscoper)
library(tibble)
library(ggplot2)

ts_raw <- get_data(subdomain = "kyy", time_id = 56)
ts_raw
#> # A tibble: 147,519 x 3
#>    date                value comment
#>    <dttm>              <dbl> <chr>
#>  1 1985-05-06 08:00:00     0 1
#>  2 1985-05-06 08:30:00     0 1
#>  3 1985-05-06 09:00:00     0 1
#>  4 1985-05-06 09:30:00     0 1
#>  5 1985-05-06 10:00:00     0 1
#>  6 1985-05-06 10:30:00     0 1
#>  7 1985-05-06 11:00:00     0 1
#>  8 1985-05-06 11:30:00     0 1
#>  9 1985-05-06 12:00:00     0 1
#> 10 1985-05-06 12:30:00     0 1
#> # … with 147,509 more rows
Let’s create a plot:
ggplot(data = ts_raw, aes(x = date, y = value))+
  geom_line()+
  labs(title= "30 min precipitation for station 200200",
       x="Date", y = "Rain height (mm)")+
  theme_classic()
Meta
- Bug reports, suggestions, and code are welcome. Please see Contributing.
- License:
- All code is licensed MIT.
- All data are from the public data sources in
http://www.hydroscope.gr/.
- To cite
hydroscoperplease use:
Vantas Konstantinos, (2018). hydroscoper: R interface to the Greek National Data Bank for
Hydrological and Meteorological Information. Journal of Open Source Software,
3(23), 625 DOI:10.21105/joss.00625
or the BibTeX entry:
@Article{kvantas2018,
author = {Konstantinos Vantas},
title = {{hydroscoper}: R interface to the Greek National Data Bank for Hydrological and Meteorological Information},
doi = {10.21105/joss.00625},
year = {2018},
month = {mar},
publisher = {The Open Journal},
volume = {2},
number = {23},
journal = {The Journal of Open Source Software}
}
