havel
Visualize and Tabulate 'R' Package Dependencies
Plot an 'R' package's recursive dependency graph and tabulate the
number of unique downstream dependencies added by top-level dependencies.
This helps 'R' package developers identify which of their declared
dependencies add the most downstream dependencies in order to prioritize
them for removal if needed. Uses graph stress minimization adapted from
Schoch (2023)
havel

The goal of havel is to vizualize and tabulate dependencies in R packages. This will help R package developers identify dependencies that contribute more to the dependency load and/or are easier to remove.
Installation
You can install the development version of havel from GitHub with:
# install.packages("pak")
pak::pak("andrewGhazi/havel")
Once available on CRAN, install like so:
install.packages("havel")
Example
havel has two main functions: plot_deps_graph() and
uniq_pkg_deps().
plot_deps_graph()
Use plot_deps_graph() to look up and plot the dependency graph of a
package:
library(havel)

plot_deps_graph("ggplot2")
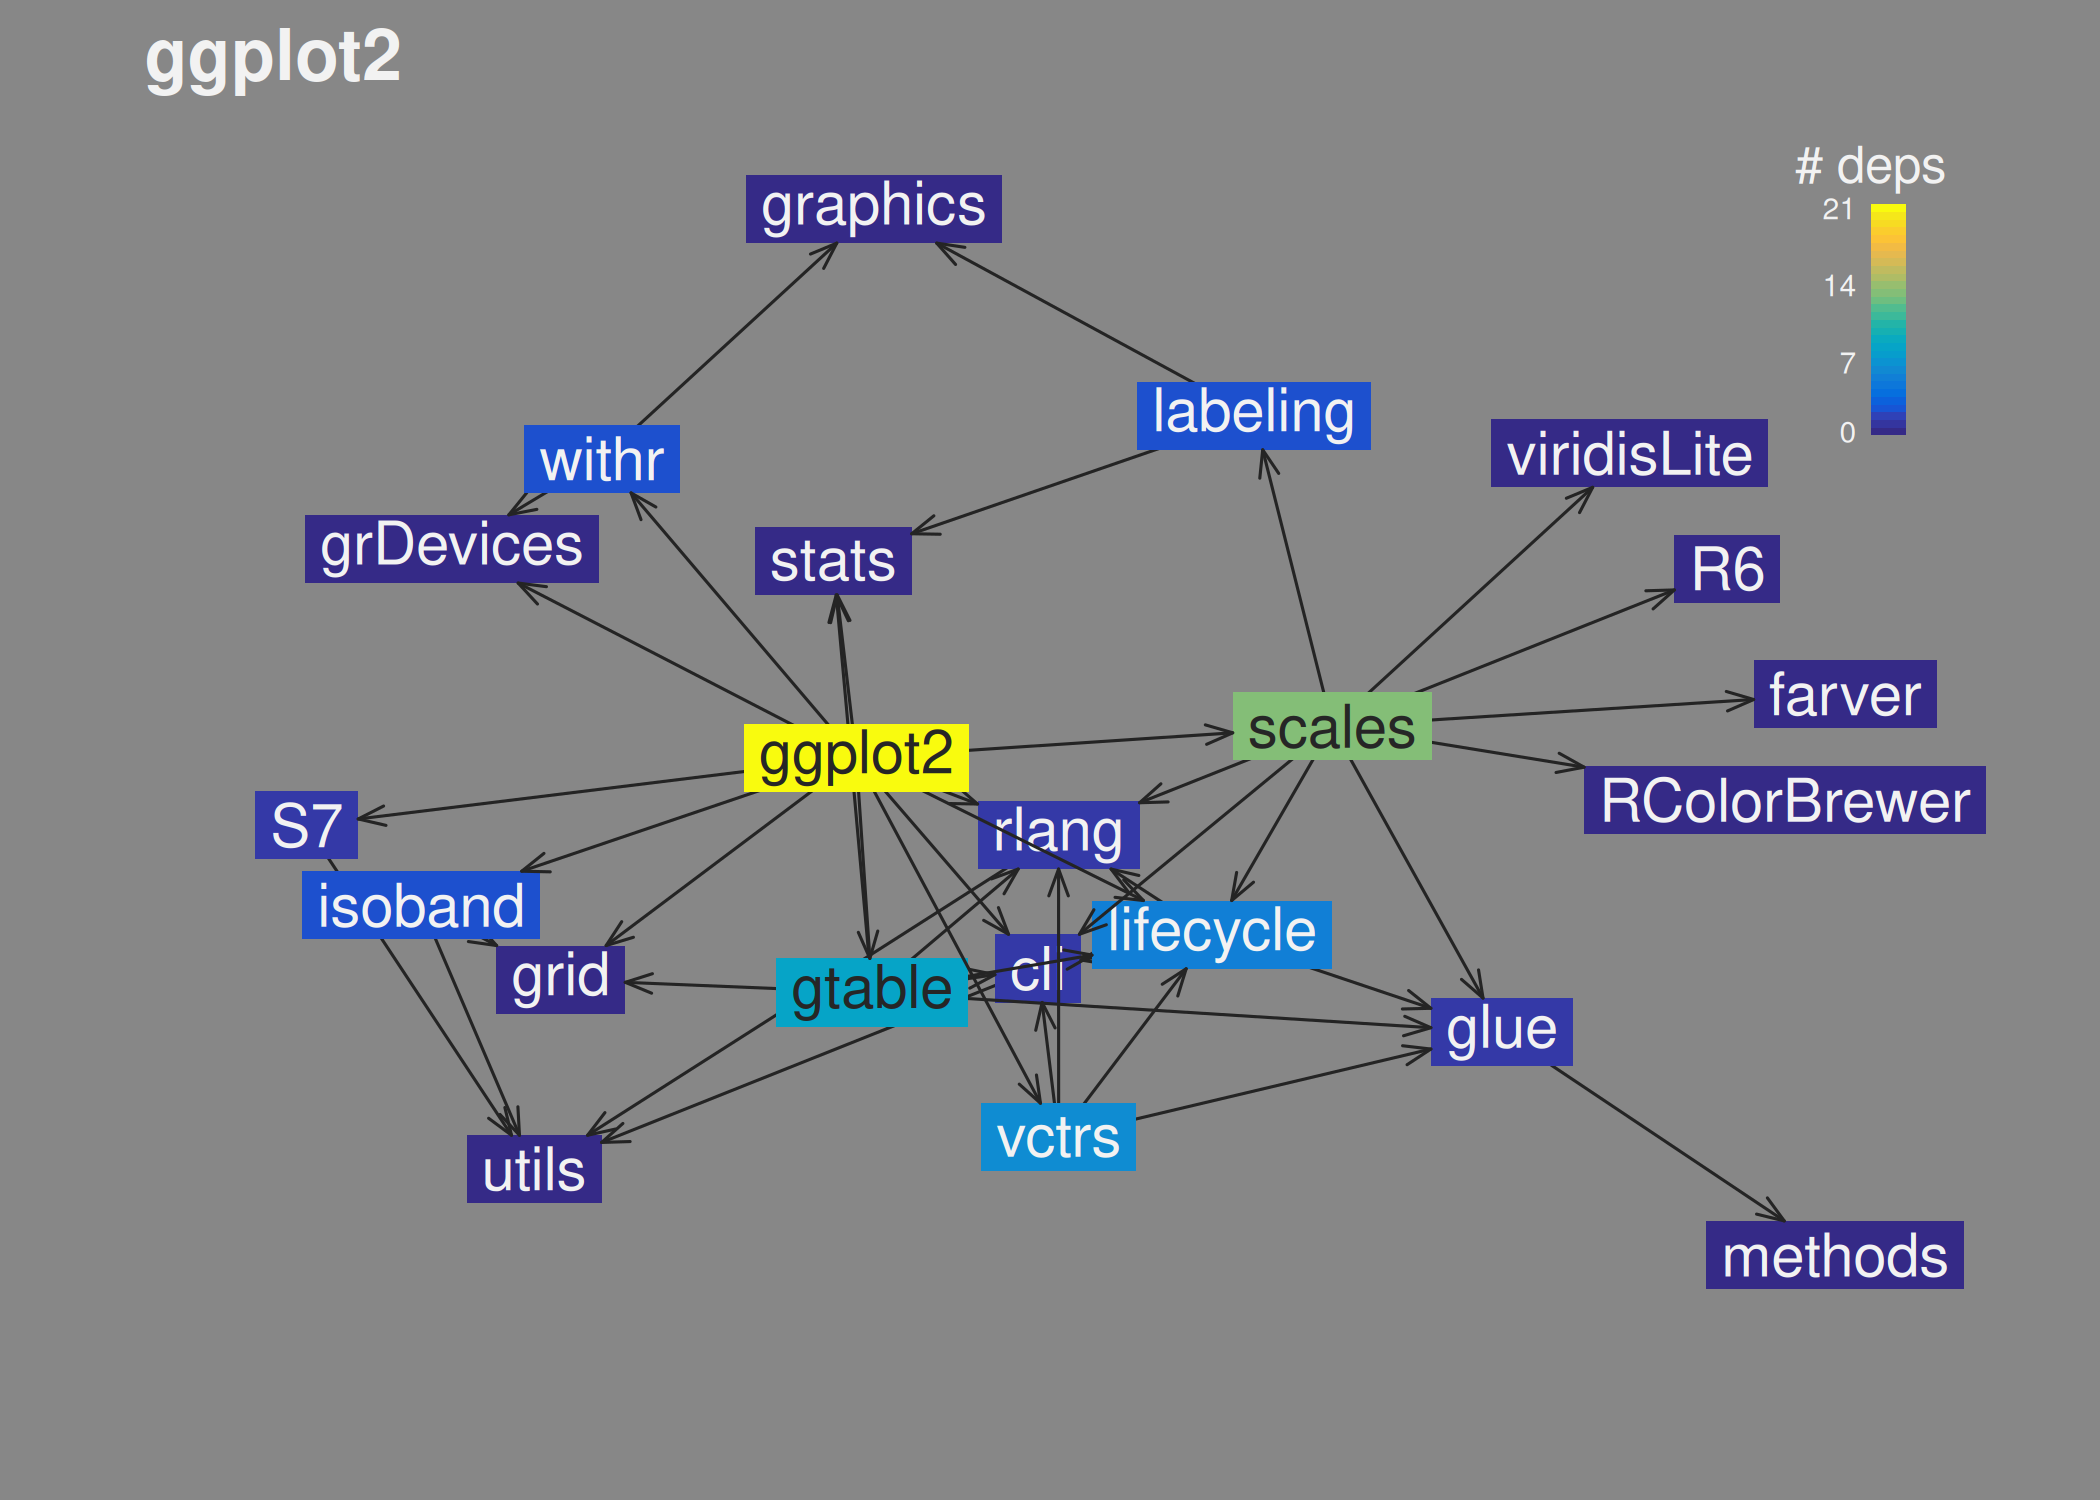
You can see that:
ggplot2has 21 dependencies in total (direct and indirect).- On the right, the
scalespackage contributes several dependencies that nothing else depends on. If theggplot2developers were looking to lighten their package (not that they should), eliminating the dependency onscalesmight be a good place to start looking.
Another example: What if I wanted to remove Rcpp as a dependency of
havel itself?
plot_deps_graph("andrewGhazi/havel") # looks it up on GitHub
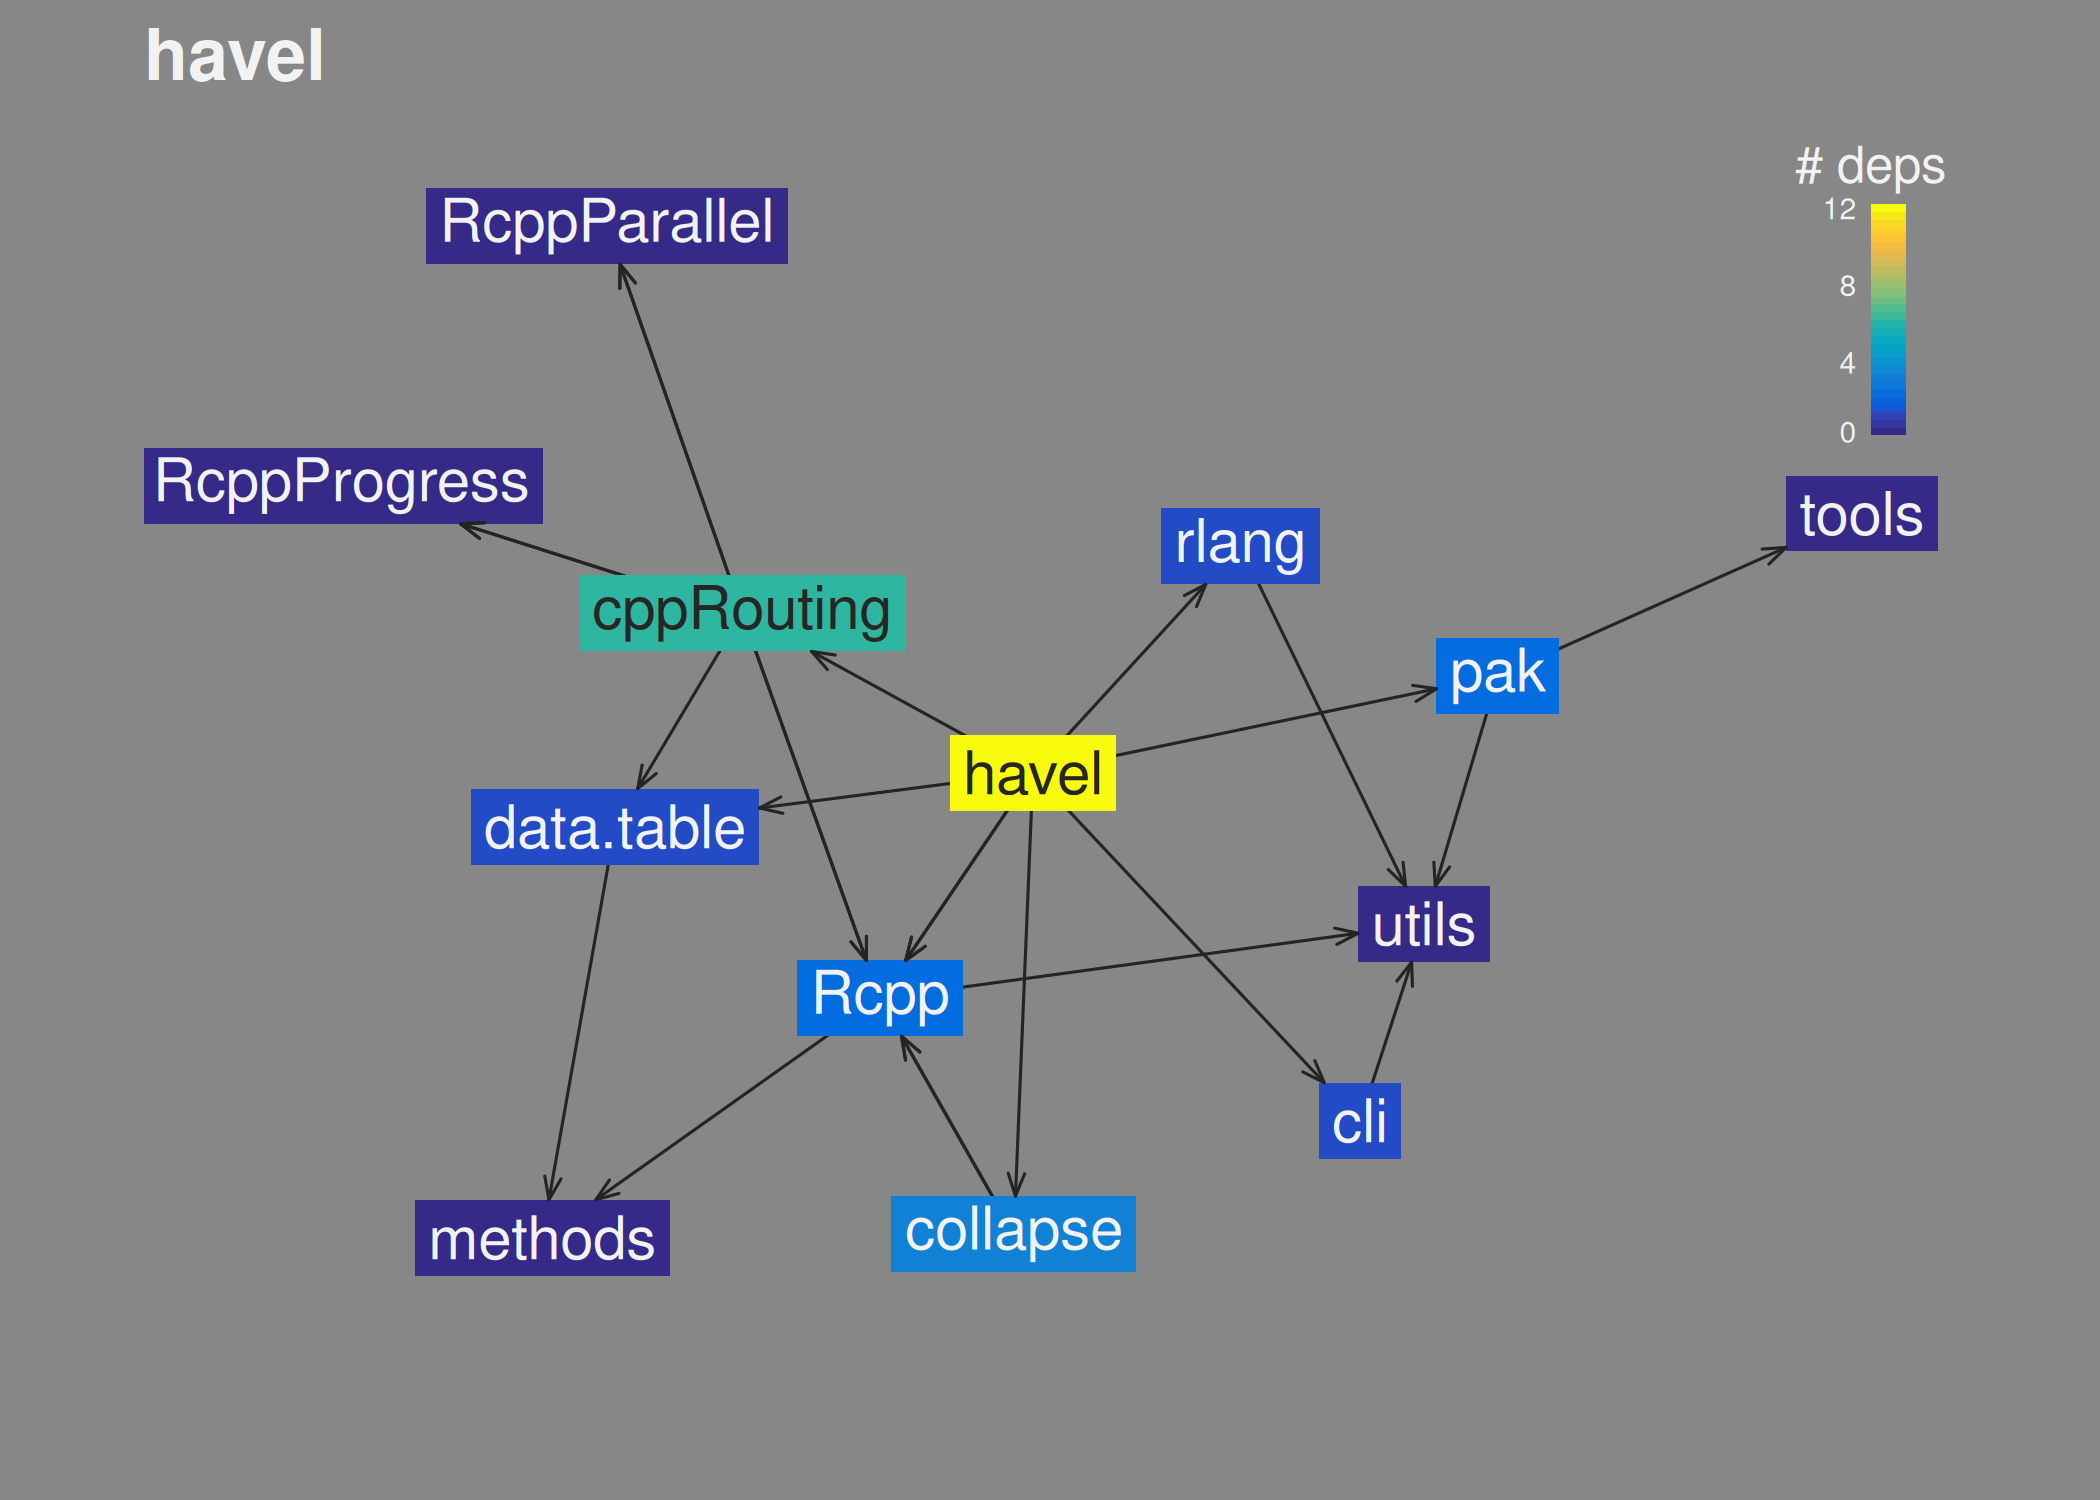
Well, looks like that would be difficult. Even if I removed the direct
dependency, there would still be an indirect dependency on Rcpp
through collapse and cppRouting. I would need to remove all three to
avoid dependence on Rcpp.
uniq_pkg_deps()
uniq_pkg_deps() tabulates what’s visually apparent on the plot:
uniq_pkg_deps("ggplot2")
#>            p1 n_uniq                                   uniq_pkgs
#>        <char>  <num>                                      <list>
#>  1:    scales      6 viridisLite,labeling,R6,farver,RColorBrewer
#>  2:       cli      1
#>  3: grDevices      1
#>  4:      grid      1
#>  5:    gtable      1
#>  6:   isoband      1
#>  7: lifecycle      1
#>  8:     rlang      1
#>  9:        S7      1
#> 10:     stats      1
#> 11:     vctrs      1
#> 12:     withr      1
scales introduces six unique dependencies to ggplot2, including
itself.
Sometimes there’s no single package that introduces many unique
dependencies, but there may be a pair or triplet that does. You can
check the impact of removing each combination of order = 2 packages
like so:
uniq_pkg_deps("ggplot2", order = 2) |>
  head()
#>           p1     p2 n_uniq                                            uniq_pkgs
#>       <char> <char>  <num>                                               <list>
#> 1:    scales  withr      8 viridisLite,labeling,graphics,R6,farver,RColorBrewer
#> 2:       cli scales      7          viridisLite,labeling,R6,farver,RColorBrewer
#> 3: grDevices scales      7          viridisLite,labeling,R6,farver,RColorBrewer
#> 4:      grid scales      7          viridisLite,labeling,R6,farver,RColorBrewer
#> 5:    gtable scales      7          viridisLite,labeling,R6,farver,RColorBrewer
#> 6:   isoband scales      7          viridisLite,labeling,R6,farver,RColorBrewer
scales + withr introduce eight.
Related/prior work
There are other packages / posts out there on this type of thing:
miniCRANhas a vignette on similar plotting functionality: “Using miniCRAN to identify package dependencies”.pkgnetoffers an expansive dependency analysis suite.depgraph(on GitHub only, not CRAN) is pretty similar but uses different aesthetic mappings.DependenciesGraphsandpkgdepRvisualize the dependencies of functions used within a package.pkgndepvisualizes similar information in a heatmap format, as well as provides different “heaviness” metrics.
havel offers some unique advantages nonetheless:
- It uses
pak::pkg_deps()to look up the dependency connections instead oftools::package_dependencies(). This enables more versatile lookups of packages on Bioc, GitHub, etc. havelitself is fairly light and fast, depending only on pak, some fastverse packages, and base R graphics…- …but it includes a ggplot version too in the Suggests if you prefer
that. Set
gg = TRUE.
- …but it includes a ggplot version too in the Suggests if you prefer
that. Set
- The default plotting parameters are carefully hand-crafted to look nice :)
FAQ
Why’d you make this?
- I was annoyed by packages with hundreds of dependencies and wanted to be able to quickly generate passive-aggressive plots visualizing their bloat.
- I wanted to learn about graph algorithms and R’s low-level graphics packages.
What’s with the name?
Havel’s Ring is an item in Dark Souls that helps you deal with excessive burdens. (Plus, every permutation of “pkg”/“dep”/“graph” was taken.)
TODO
- more tests
- properly handle cases with
0/1 deps, local packages, etc
- properly handle cases with
- color edges by dependency type
copy over ggplot version✓- highlight direct dependencies
uniq_pkg_deps() function✓- eliminate my precious pipes so I don’t require R >= 4.1
Fix missing arrows between base packages (e.g. currently there are arrows missing frommethods→utils,stats)- This can be fixed by setting
info_method = "tools"
- This can be fixed by setting