ggpsychro
Create Psychrometric Charts
Provides 'ggplot2' coordinates, layers, scales, themes, and presets for
creating psychrometric charts. The package supports metric and inch-pound
unit systems, psychrometric grids, state points, process lines, zones, and
thermal comfort overlays for heating, ventilation, air conditioning, and
building performance workflows. Psychrometric property calculations are
based on 'PsychroLib' (Meyer and Thevenard, 2019)
ggpsychro

‘ggplot2’ extension for making psychrometric charts.
Features
- ggplot2-native psychrometric charts with SI/IP units and Mollier orientation.
- Preset grid and style helpers for common psychrometric chart layouts.
- ASHRAE-style psychrometric protractor for sensible heat ratio and heat-moisture-ratio guides in the chart mask area.
- Psychrometric stats for relative humidity, wet-bulb temperature, vapor pressure, specific volume, enthalpy, and humidity ratio.
- State points, process lines, and filled operating zones for HVAC workflows.
- Thermal comfort and bioclimatic overlays for PMV/PPD, SET, adaptive comfort, labelled contours, Heat Index, PMV-based ASHRAE 55 / EN 15251 zones, and Givoni-Milne strategy zones.
Installation
You can install the released version of ggpsychro from CRAN with:
install.packages("ggpsychro")
You can install the development version from GitHub with:
# install.packages("remotes")
remotes::install_github("hongyuanjia/ggpsychro")
Example
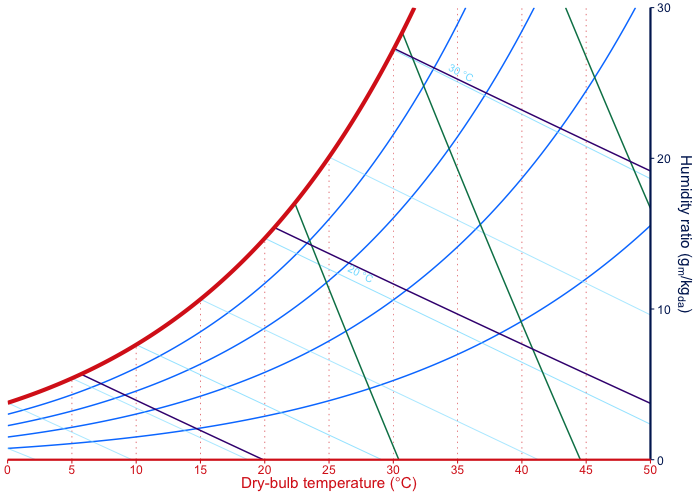
The creation of a psychrometric chart starts with ggpsychro(). The
result is a ggplot object, so grids, stats, geoms, scales, and themes
can be added with the same + workflow used by ggplot2.
ggpsychro(tdb_lim = c(0, 50), hum_lim = c(0, 30)) +
    psychro_preset("minimal")
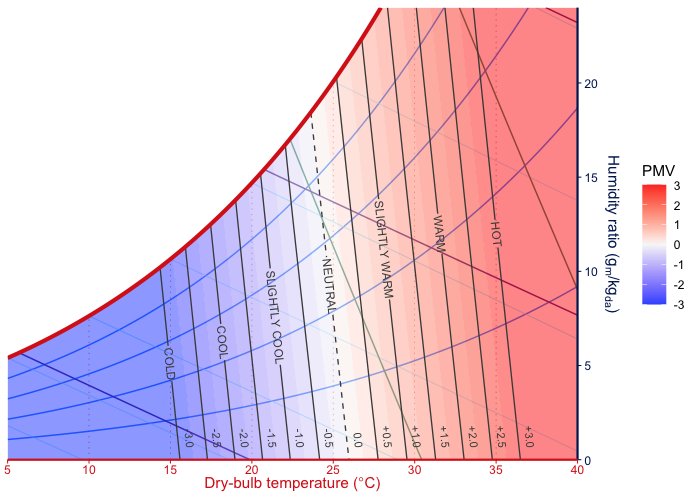
Comfort overlays can be added as regular layers. The PMV overlay combines root-traced filled bands, PMV isolines, and text labels on the same psychrometric chart.
ggpsychro(tdb_lim = c(5, 40), hum_lim = c(0, 24)) +
    psychro_preset("minimal") +
    geom_comfort_pmv(
        contour_levels = seq(-3, 3, by = 0.5),
        n = c(70, 48)
    ) +
    scale_fill_comfort_pmv(name = "PMV")
Learn more
The longer examples live on the pkgdown site:
- Get started - build basic charts, choose limits and units, use Mollier orientation, and add ggplot layers.
- Chart grids and styles - tune dry-bulb, humidity-ratio, relative-humidity, wet-bulb, enthalpy, and specific-volume grid guides, plus the psychrometric protractor.
- Plotting psychrometric data - plot points, bins, and overlays from weather or measured state data.
- Comfort overlays - draw PMV, SET, adaptive comfort, labelled comfort contours, Heat Index, PMV-based standard zones, and Givoni-Milne strategy overlays.
- Zones and processes - draw manual comfort regions, operating limits, state points, and HVAC process lines.
Acknowledgements
ggpsychro’s recent chart-layout and higher-level layer work was informed by two excellent psychrometric chart projects:
- psychrochart, especially its preset-oriented chart configuration, labelled reference grids, zone support, and export-focused chart composition.
- Andrew Marsh’s Psychrometric Chart, especially its interactive psychrometric workflows, weather/data overlays, comfort display ideas, and import/export-oriented chart interactions.
ggpsychro does not vendor code from those projects. The implementation remains R/ggplot2-native, with psychrometric property calculations delegated to PsychroLib where appropriate.
Author
Hongyuan Jia
License
The project is released under the terms of MIT License.
Copyright © 2019-2026 Hongyuan Jia
Contribute
Please note that the ‘ggpsychro’ project is released with a Contributor Code of Conduct. By contributing to this project, you agree to abide by its terms.