ggflowchart
Flowcharts with 'ggplot2'
Flowcharts can be a useful way to visualise complex processes. This package uses the layered grammar of graphics of 'ggplot2' to create simple flowcharts.

{ggflowchart} 
{ggflowchart} is an R package for producing flowcharts using {ggplot2}.
Installation
Install the package from CRAN using:
install.packages("ggflowchart")
or install the development version from GitHub:
remotes::install_github("nrennie/ggflowchart")
Usage
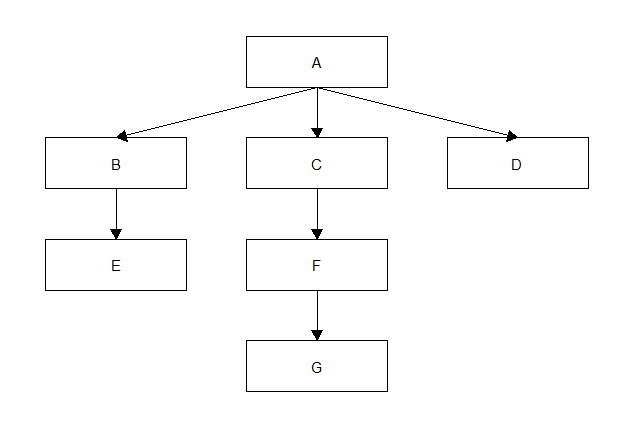
The idea of {ggflowchart} is to create simple flowcharts with minimal effort. Currently, all flowcharts are constructed using the ggflowchart() function. For the most basic flowchart, it takes as input a data frame containing (at least) two columns for the start and end points of the edges in the flowchart.
data <- tibble::tibble(from = c("A", "A", "A", "B", "C", "F"),
                       to = c("B", "C", "D", "E", "F", "G"))
The flowchart is then created using ggflowchart().
ggflowchart(data)
See vignettes for further examples of usage.
Upcoming features
Note: this package is currently a work-in-progress. Upcoming features that are currently listed as issues being worked on include:
- Changing node outline
colourbased on node attributes. - Changing
linetypeandcolourof arrows based on edge attributes. - Same-level arrows (currently an issue with crossing over).
If you have a suggestion of an additional feature, or find a bug, please file an issue on the GitHub repository.