ggfixest
Dedicated 'ggplot2' Methods for 'fixest' Objects
Provides 'ggplot2' equivalents of fixest::coefplot() and fixest::iplot(), for producing nice coefficient plots and interaction plots. Enables some additional functionality and convenience features, including grouped multi-'fixest' object faceting and programmatic updates to existing plots (e.g., themes and aesthetics).
ggfixest




The ggfixest package provides dedicated ggplot2 plotting methods
for fixest objects. Specifically, it provides drop-in “gg”
equivalents of the latter’s
coefplot
and iplot
base plotting functions.
The goal of ggfixest is to produce nice looking coefficient plots and interaction plots—including event study plots—with minimal effort and scope for further customization.
Installation
The stable version of ggfixest is available on CRAN.
install.packages("ggfixest")
Or, you can grab the latest development version from R-universe.
install.packages("ggfixest", repos = "https://grantmcdermott.r-universe.dev")
Quickstart
The package website provides a
number of examples in the help documentation. (Also available by typing
?ggcoefplot or ?ggiplot in your R console.) But here are a few
quickstart examples to whet your appetite.
Start by loading the ggfixest package.
library(ggfixest)
#> Loading required package: ggplot2
#> Loading required package: fixest
Note that this automatically loads ggplot2 and fixest as required dependencies too. As the package name suggests, ggfixest only supports fixest model objects.[^1]
Coefficient plots
Use ggcoefplot to draw basic coefficient plots.
est = feols(
  Petal.Length ~ Petal.Width + Sepal.Length + Sepal.Width + Species,
  data = iris
)

# coefplot(est) ## base version
ggcoefplot(est) ## this package
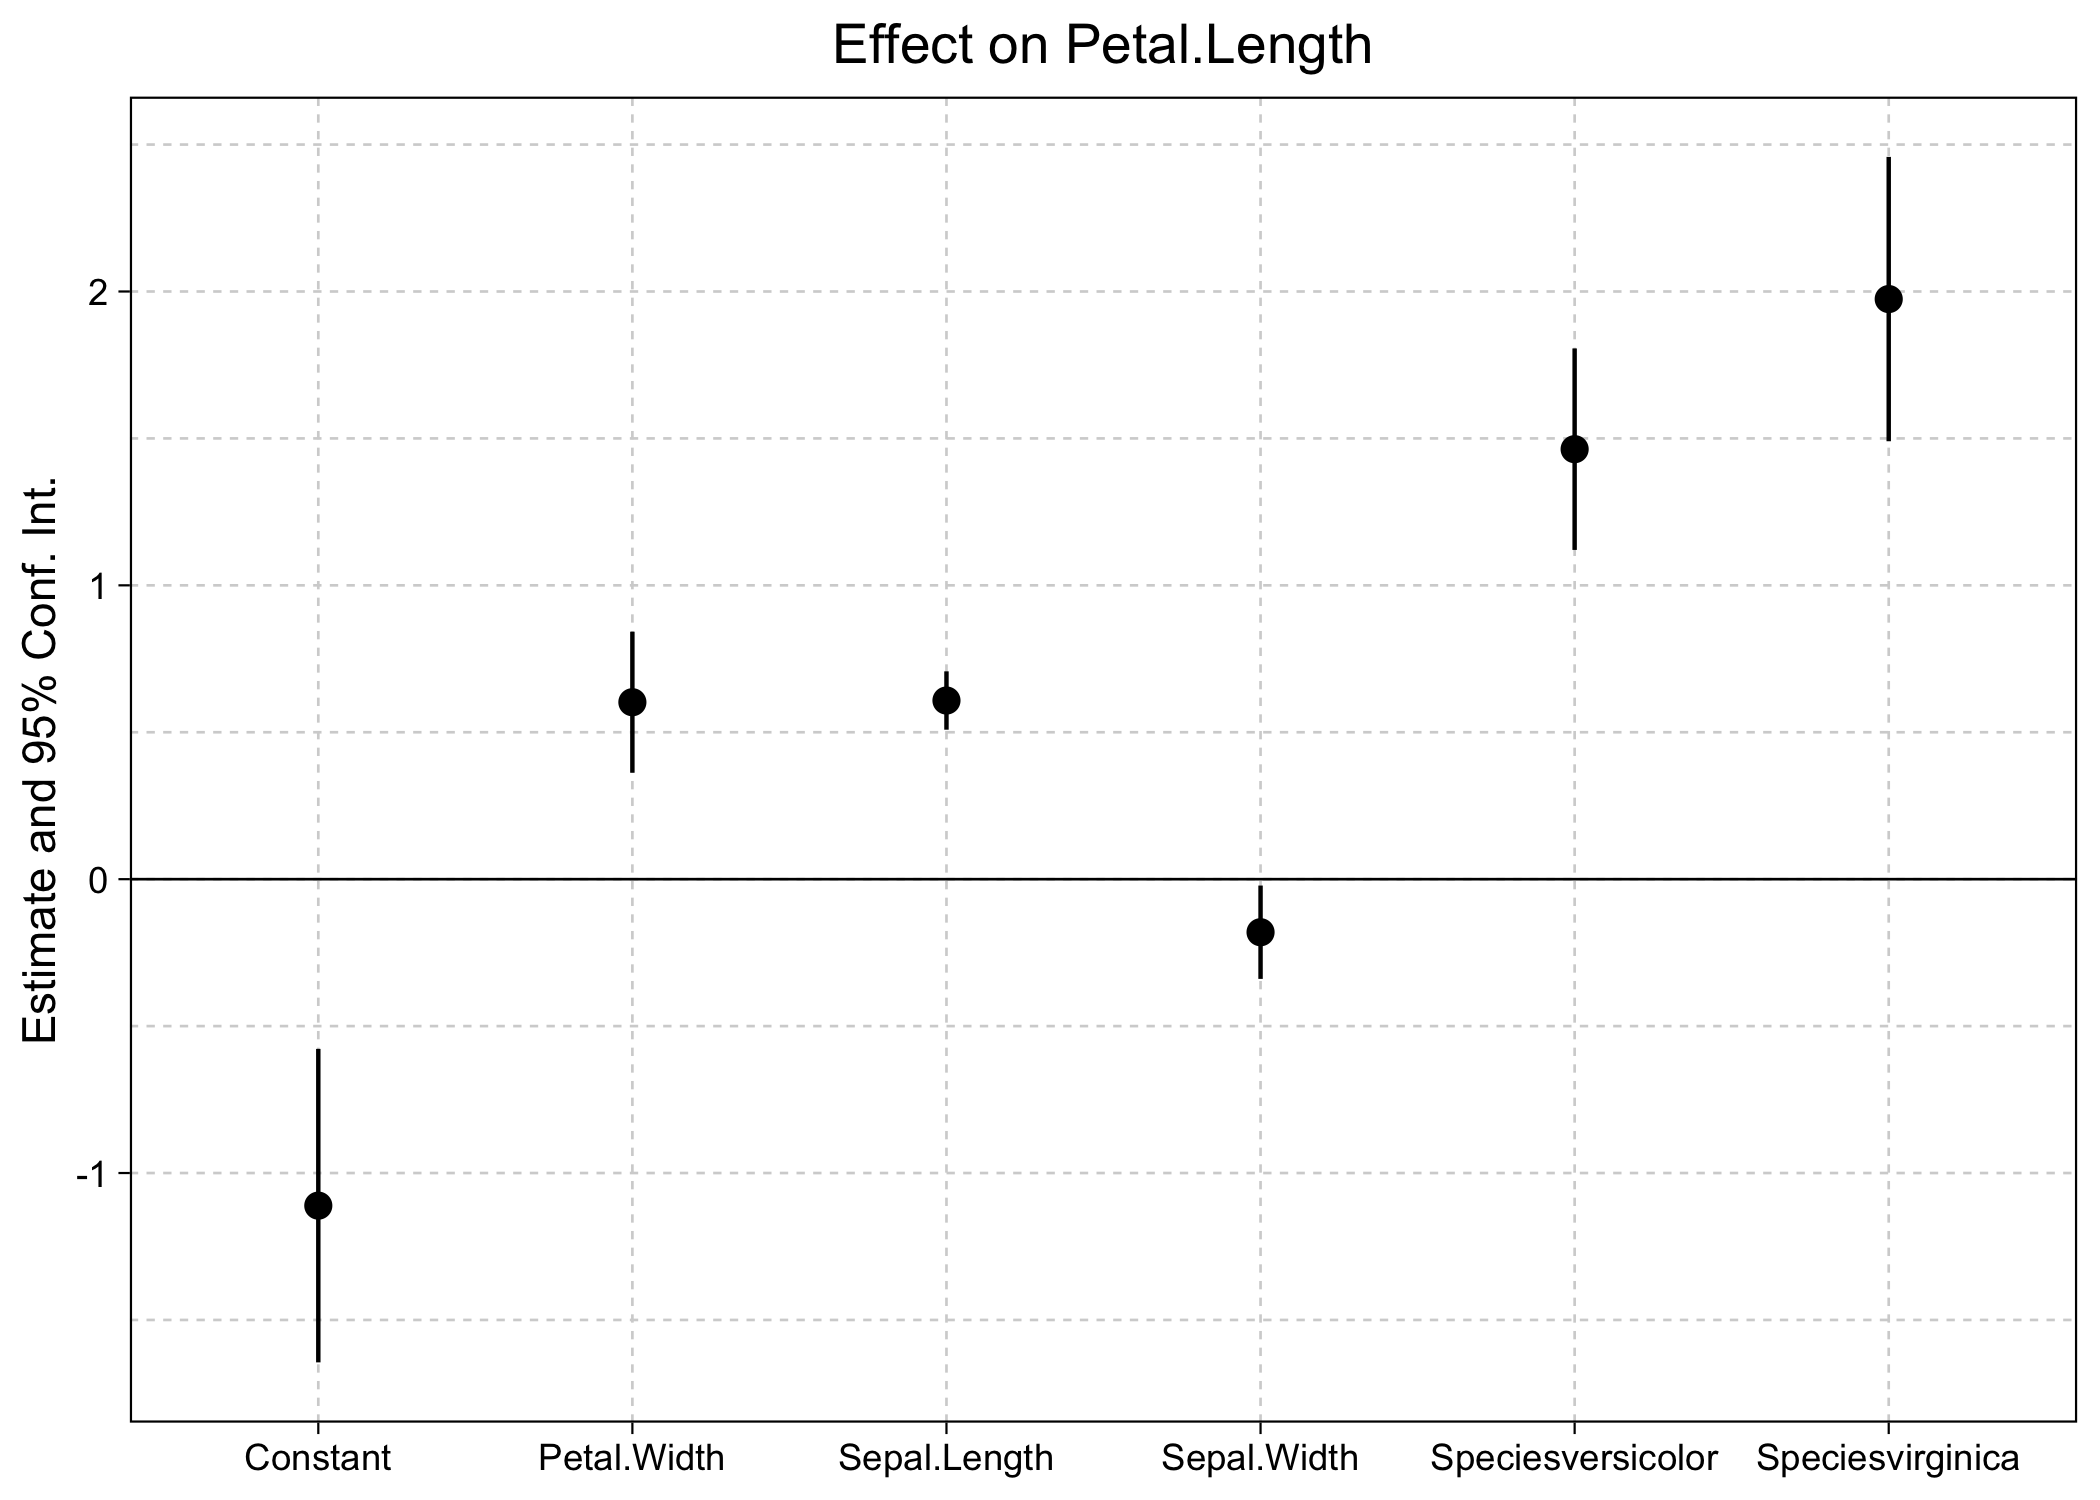
The above plot call and output should look very familiar to regular
fixest users. Like its base equivalent, ggcoefplot can be heavily
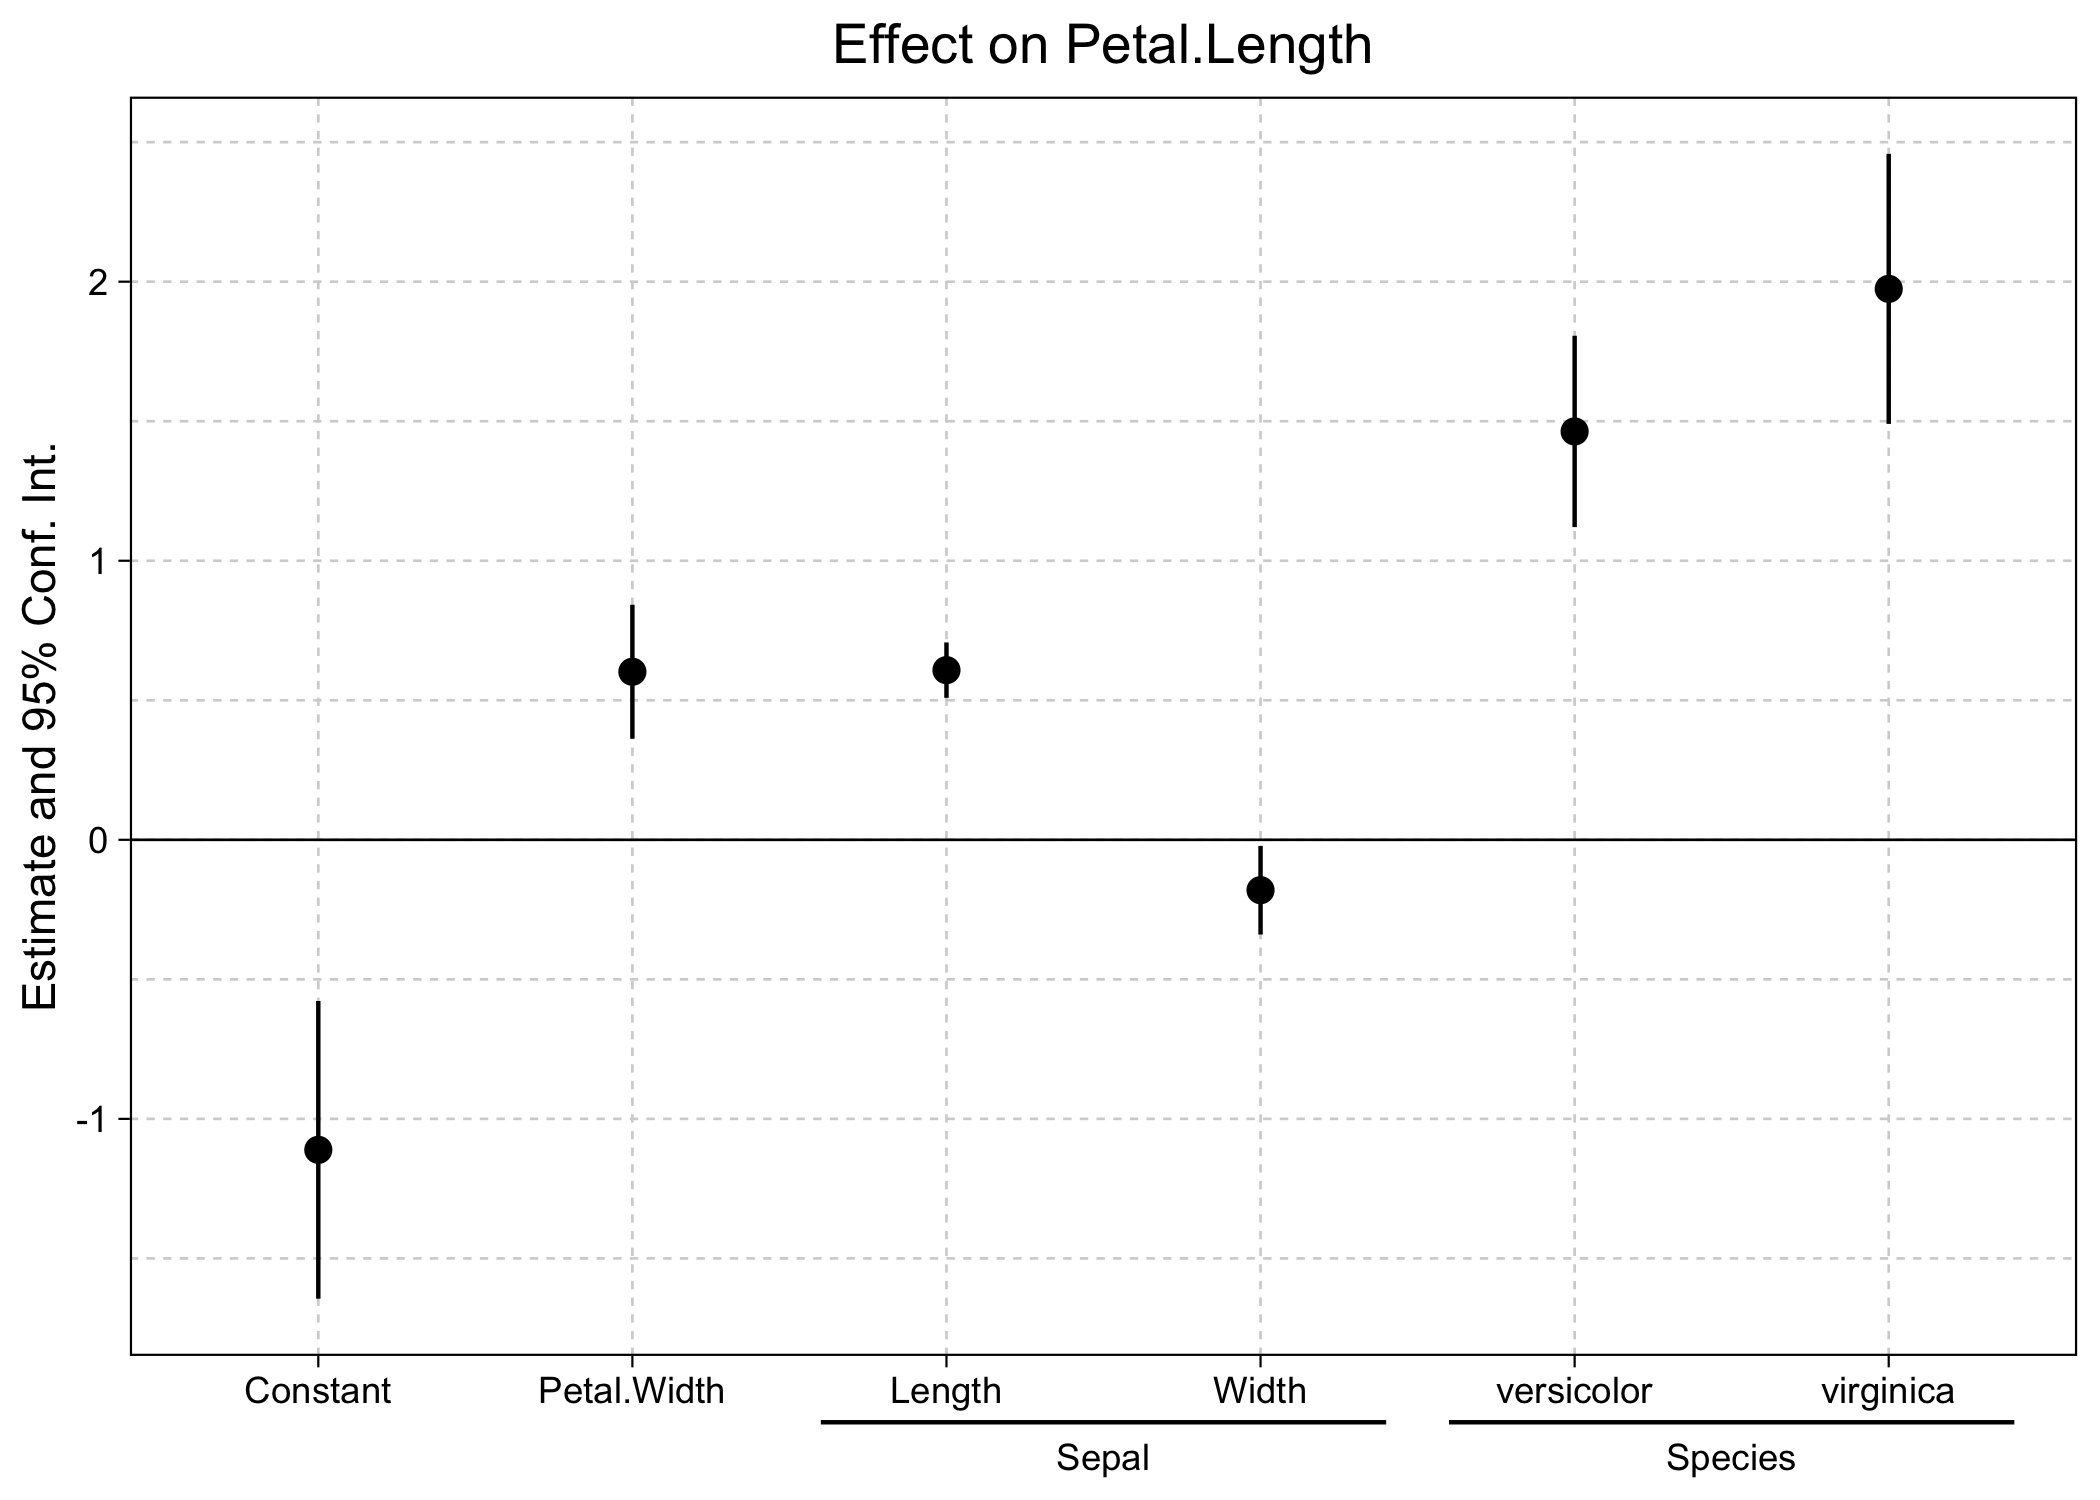
customized and contains various shortcuts for common operations. For
example, we can use regex to control the coefficient grouping logic.
ggcoefplot(est, group = list(Sepal = "^^Sepal.", Species = "^^Species"))
Event study plots
The ggiplot function is a special case of ggocoefplot that only
plots coefficients with factor levels or interactions (specifically,
those created with the
i operator). This
is especially useful for producing event study plots in a
difference-in-differences (DiD) setup.
est_did = feols(y ~ x1 + i(period, treat, 5) | id+period, base_did)

# iplot(est_did) ## base version
ggiplot(est_did) ## this package
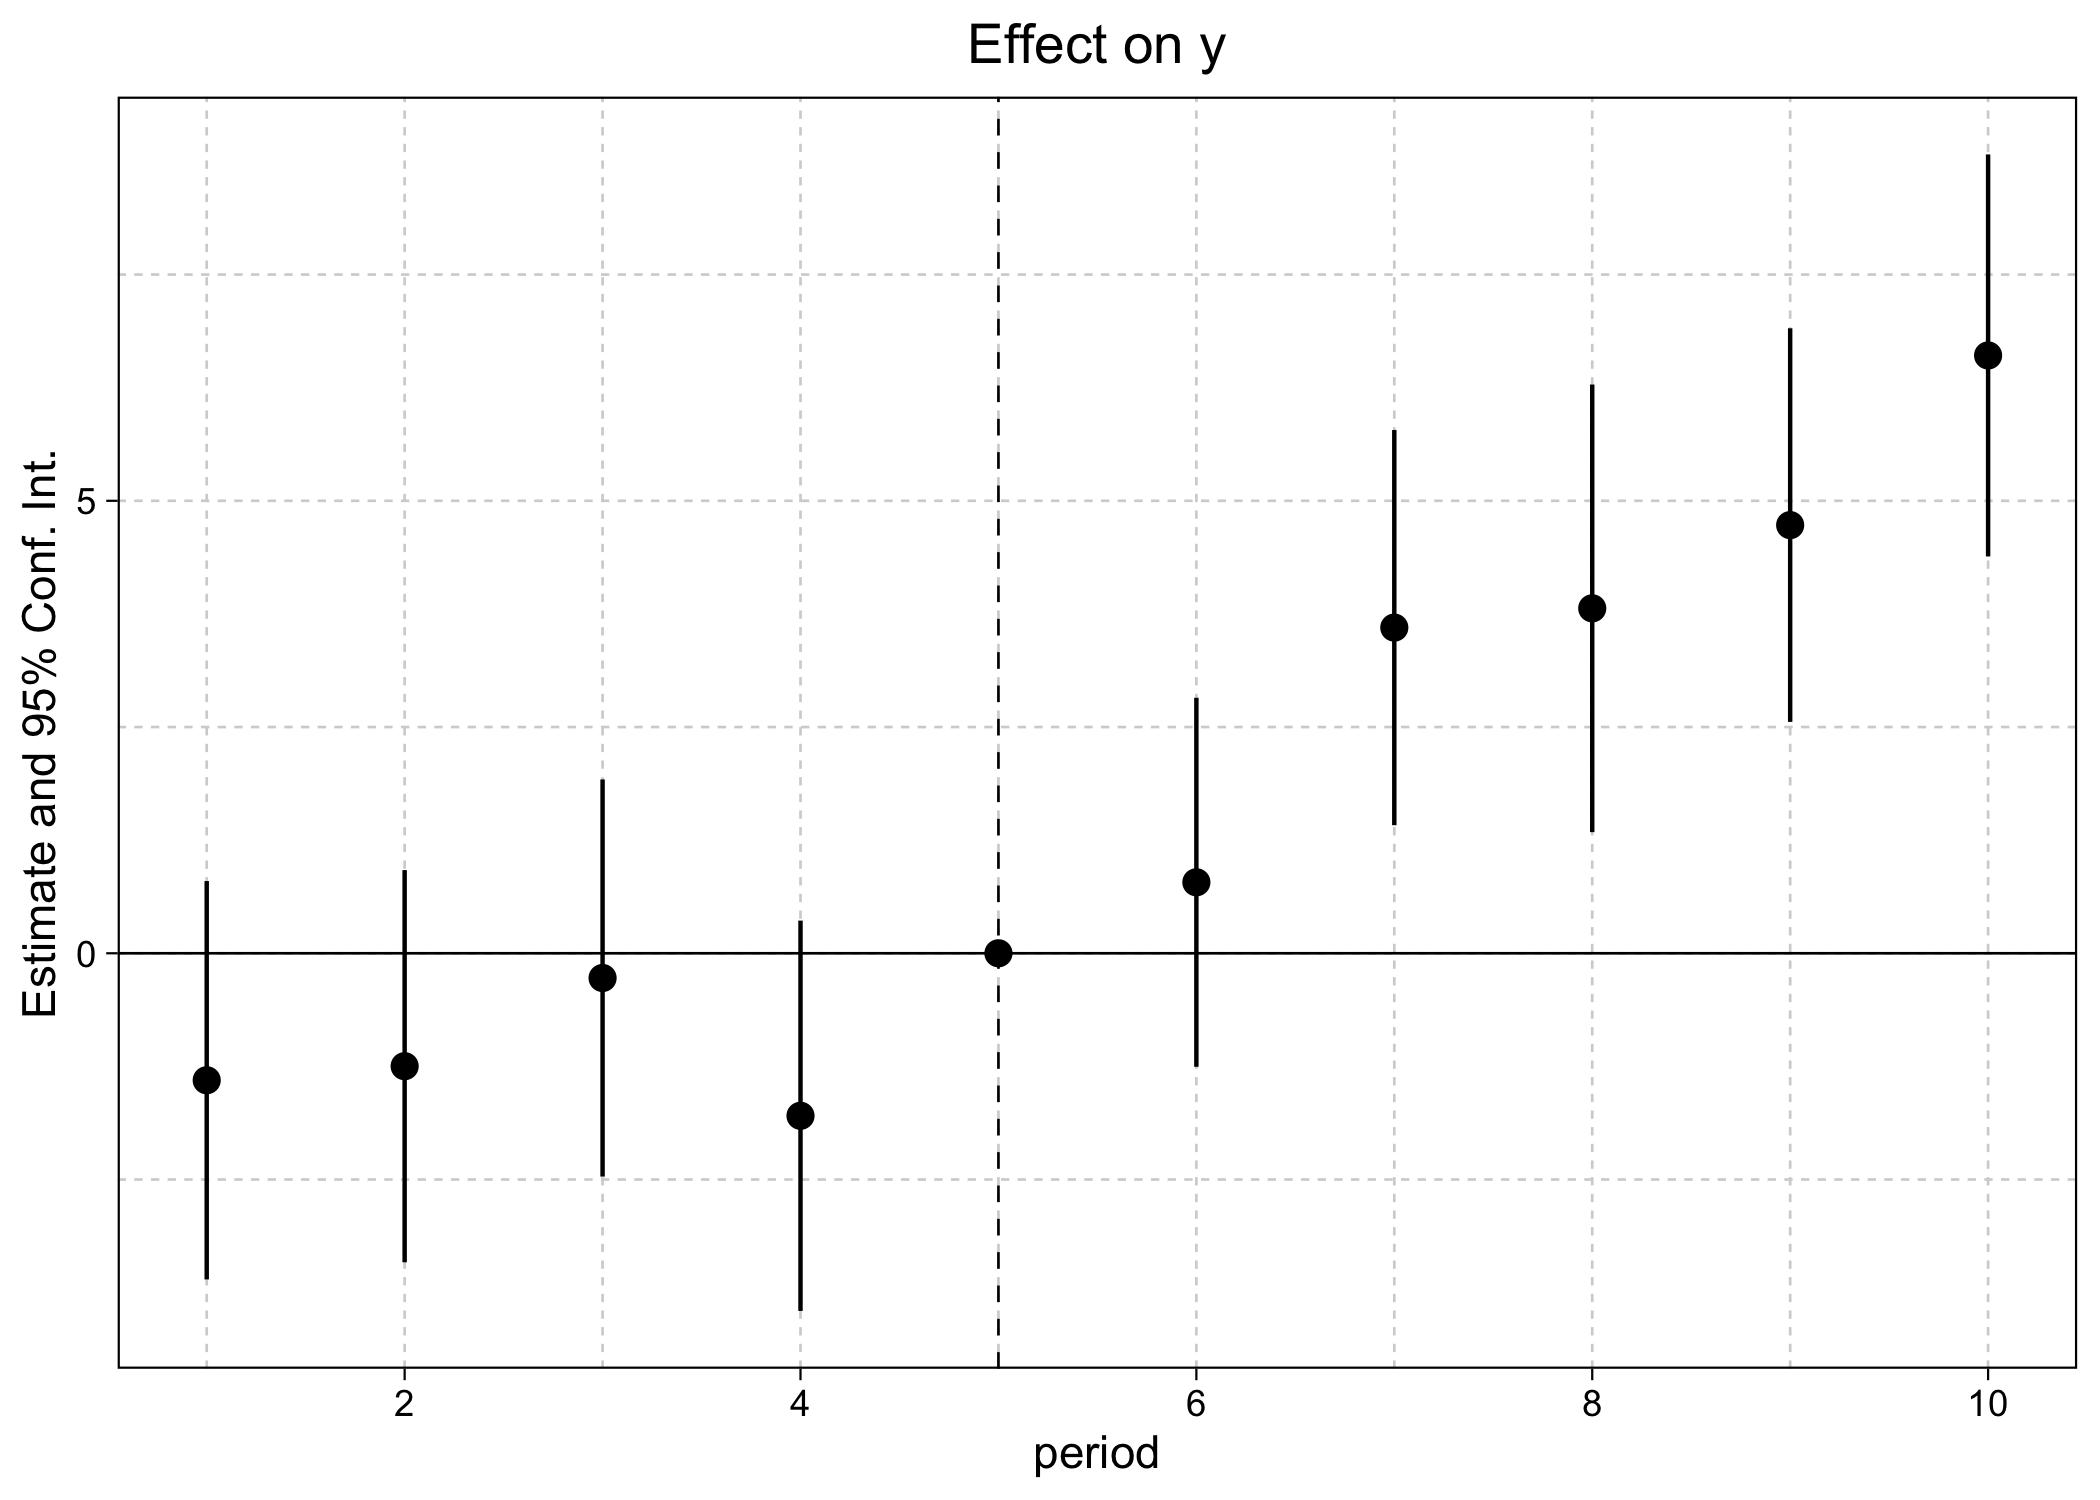
Again, the above plot call and output should look very familiar to
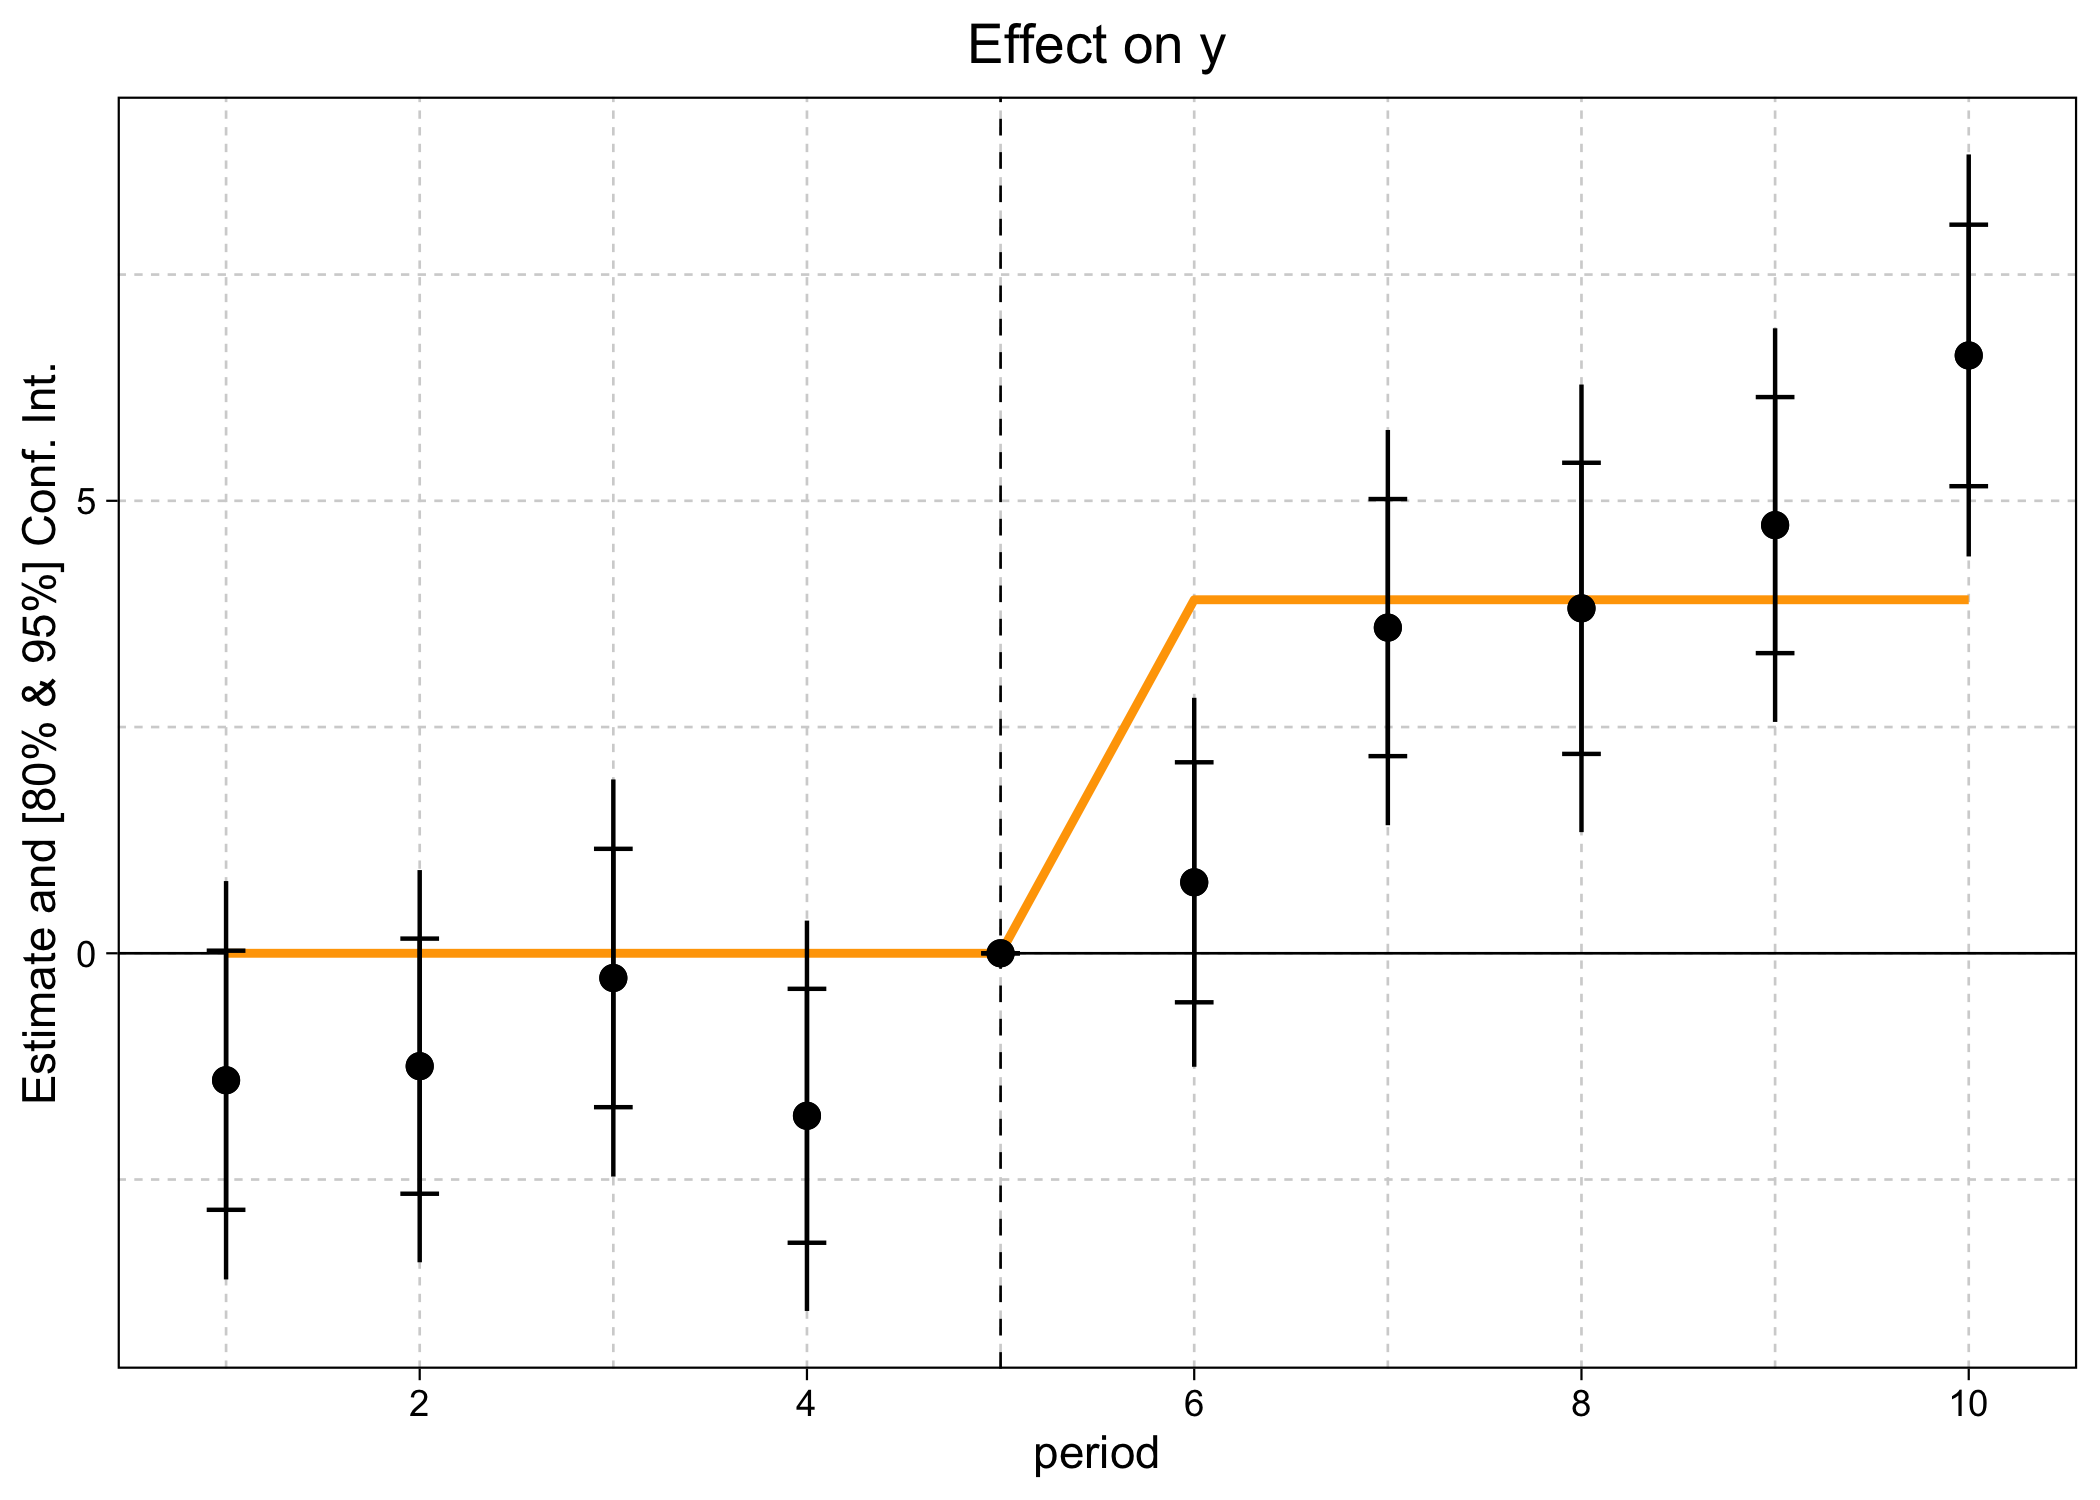
regular fixest users. But note that ggiplot supports several
features that are not available in the base iplot version. For
example, plotting multiple confidence intervals and aggregate treatments
effects.
ggiplot(
    est_did,
    ci_level = c(.8, .95),
    aggr_eff = "post", aggr_eff.par = list(col = "orange")
)
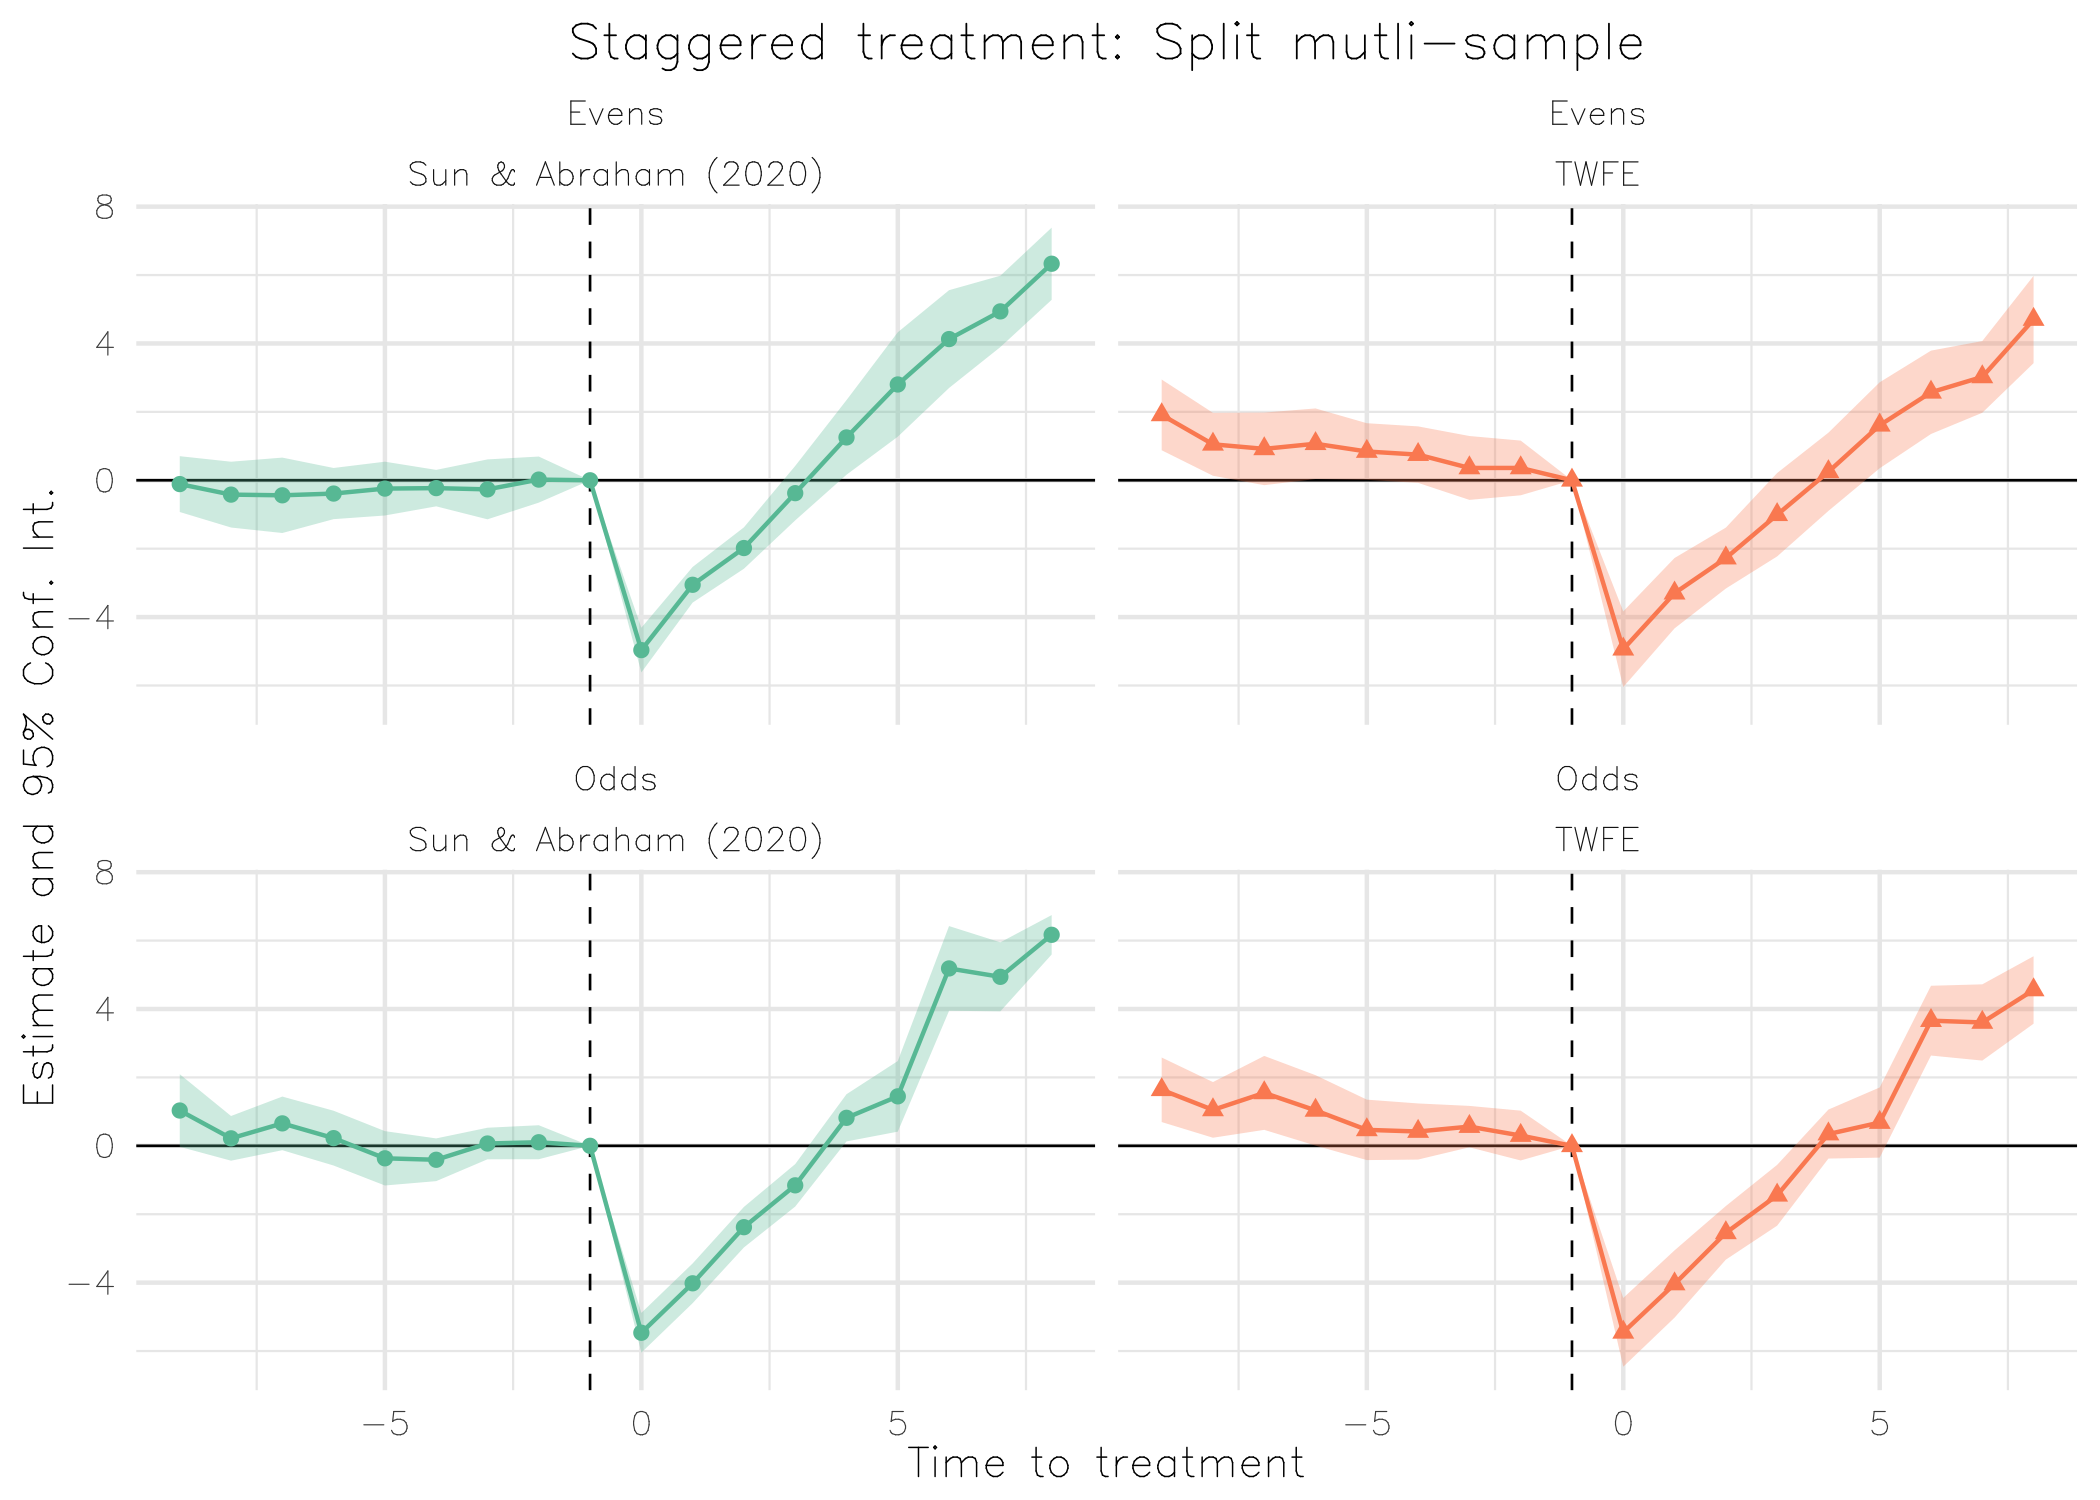
And you can get quite fancy, combining lists of complex multiple estimation objects with custom themes, and so on.
base_stagg_grp = base_stagg
base_stagg_grp$grp = ifelse(base_stagg_grp$id %% 2 == 0, 'Evens', 'Odds')

est_twfe_grp = feols(
    y ~ x1 + i(time_to_treatment, treated, ref = c(-1, -1000)) | id + year,
    data = base_stagg_grp, split = ~grp
)

est_sa20_grp = feols(
    y ~ x1 + sunab(year_treated, year) | id + year,
    data = base_stagg_grp, split = ~grp
)

ggiplot(
    list("TWFE" = est_twfe_grp, "Sun & Abraham (2020)" = est_sa20_grp),
    ref.line = -1,
    main = "Staggered treatment: Split mutli-sample",
    xlab = "Time to treatment",
    multi_style = "facet",
    geom_style = "ribbon",
    facet_args = list(labeller = labeller(id = \(x) gsub(".*: ", "", x))),
    theme = theme_minimal() +
        theme(
            text = element_text(family = "HersheySans"),
            plot.title = element_text(hjust = 0.5),
            legend.position = "none"
        )
)
For more ggiplot examples and comparisons with its base counterpart,
see the detailed
vignette on
the package homepage (or, by typing vignette("ggiplot") in your R
console).
[^1]: For other model classes, a more generic visualization package/tool like see or modelsummary would be more appropriate.