ggalignment
Plots 'D&D'-Style Alignment Charts
'D&D' alignment charts show 9 boxes with values for good through evil and values for chaotic through lawful. This package easily creates these alignment charts from user-provided image paths and alignment values.
ggalignment


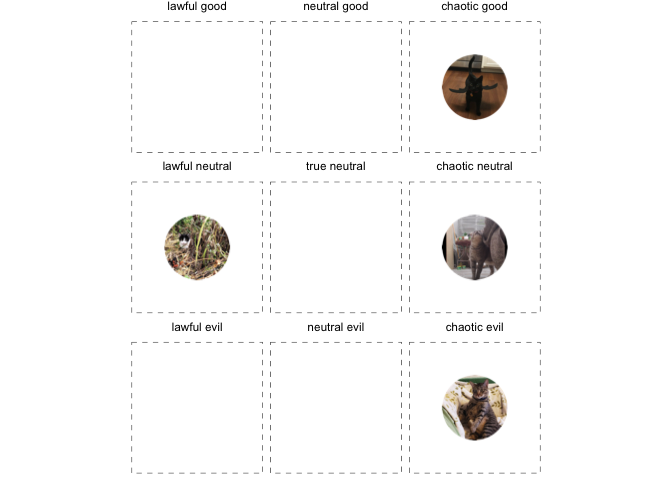
The goal of ggalignment is to do one thing – create DnD-style alignment charts! These charts range from lawful to neutral to chaotic in one dimension, and good to neutral to evil in the other. Pictures or text can be placed in each of boxes to indicate the alignment.
Installation
You can install the development version from GitHub with:
# install.packages("devtools")
devtools::install_github("aftonsteps/ggalignment")
You can install the release version from CRAN with:
install.packages("ggalignment")
Example
This is a basic example which shows you how to use ggalignment:
library(ggalignment)

# an example dataframe of cats!
align_cats <- example_cats()
ggalignment(align_cats)