RepertoiR
Repertoire Graphical Visualization
Visualization platform for T cell receptor repertoire
analysis output results. It includes comparison of sequence frequency
among samples, network of similar sequences and convergent
recombination source between species. Currently repertoire analysis is
in early stage of development and requires new approaches for
repertoire data examination and assessment as we intend to develop.
No publication is available yet (will be available in the near
future), Efroni (2021)
RepertoiR
Visualization platform for T cell receptor repertoire analysis output results. It includes comparison of sequence frequency among samples, network of similar sequences and convergent recombination source between species. Currently repertoire analysis is in early stage of development and requires new approaches for repertoire data examination and assessment as we intend to develop.
Installation
You can install the development version of RepertoiR from version from GitHub with:
# install.packages("devtools")
devtools::install_github("systemsbiomed/RepertoiR")
Quick demo
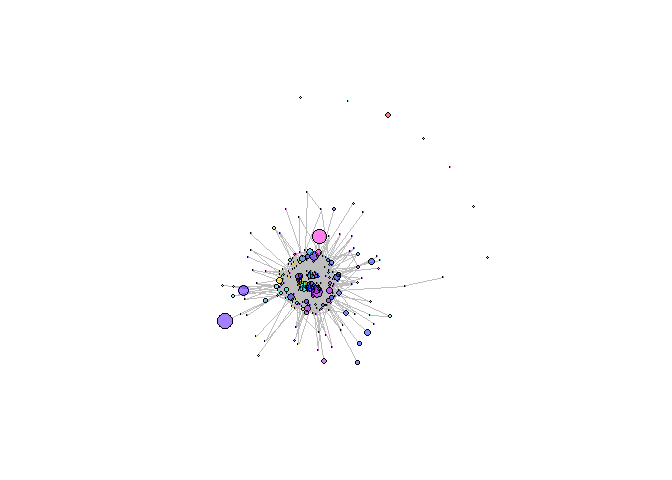
Creating network graph of TCR repertoire’s clonotypes:
library(RepertoiR)

aa <- c(
  "G", "A", "V", "L", "I", "P", "F", "Y", "W", "S",
  "T", "N", "Q", "C", "M", "D", "E", "H", "K", "R"
)
data <- matrix(rexp(1 / 2, n = 1000), ncol = 4)
cons <- sample(aa, 10)
aavec <- c()

while (length(aavec) < nrow(data)) {
  aaseq <- cons
  index <- sample(length(aaseq), sample(length(aaseq) / 3, 1))
  aaseq[index] <- sample(aa, length(index), replace = TRUE)
  aaseq <- paste0(aaseq, collapse = "")
  aavec <- unique(append(aavec, aaseq))
}

rownames(data) <- aavec
colnames(data) <- LETTERS[1:ncol(data)]
In that case, don’t forget to commit and push the resulting figure files, so they display on GitHub and CRAN.