OmicNetR
Network-Based Integration of Multi-Omics Data Using Sparse CCA
Provides an end-to-end workflow for integrative analysis of
two omics layers using sparse canonical correlation analysis (sCCA),
including sample alignment, feature selection, network edge construction,
and visualization of gene-metabolite relationships. The underlying methods
are based on penalized matrix decomposition and sparse CCA
(Witten, Tibshirani and Hastie (2009)

OmicNetR
OmicNetR is an R package for integrative multi-omics analysis using Sparse Canonical Correlation Analysis (sCCA). It supports an end-to-end workflow for aligning multi-omics datasets, fitting an sCCA model, creating a gene–metabolite bipartite network, and generating summary visualizations.
Installation
Development version (GitHub)
install.packages("devtools")
devtools::install_github("ppchaudhary/OmicNetR")
library(OmicNetR)
Quick start
set.seed(123)

omics_data <- generate_dummy_omics(
  n_samples = 60,
  n_genes = 800,
  n_metabolites = 150,
  n_linked = 20
)

X <- omics_data$X
Y <- omics_data$Y

aligned <- align_omics(X, Y)
## Successfully aligned 60 matching samples.
scca_model <- omic_scca(
  X = aligned$X,
  Y = aligned$Y,
  n_components = 2,
  penalty_X = 0.70,
  penalty_Y = 0.70
)
## Model Optimization: Keeping 240 genes and 45 metabolites.
net_data <- scca_to_network(
  scca_model,
  comp_select = 1,
  weight_threshold = 0.01
)

# Keep top edges for a cleaner plot
net_data <- net_data[order(abs(net_data$Weight_Product), decreasing = TRUE), ]
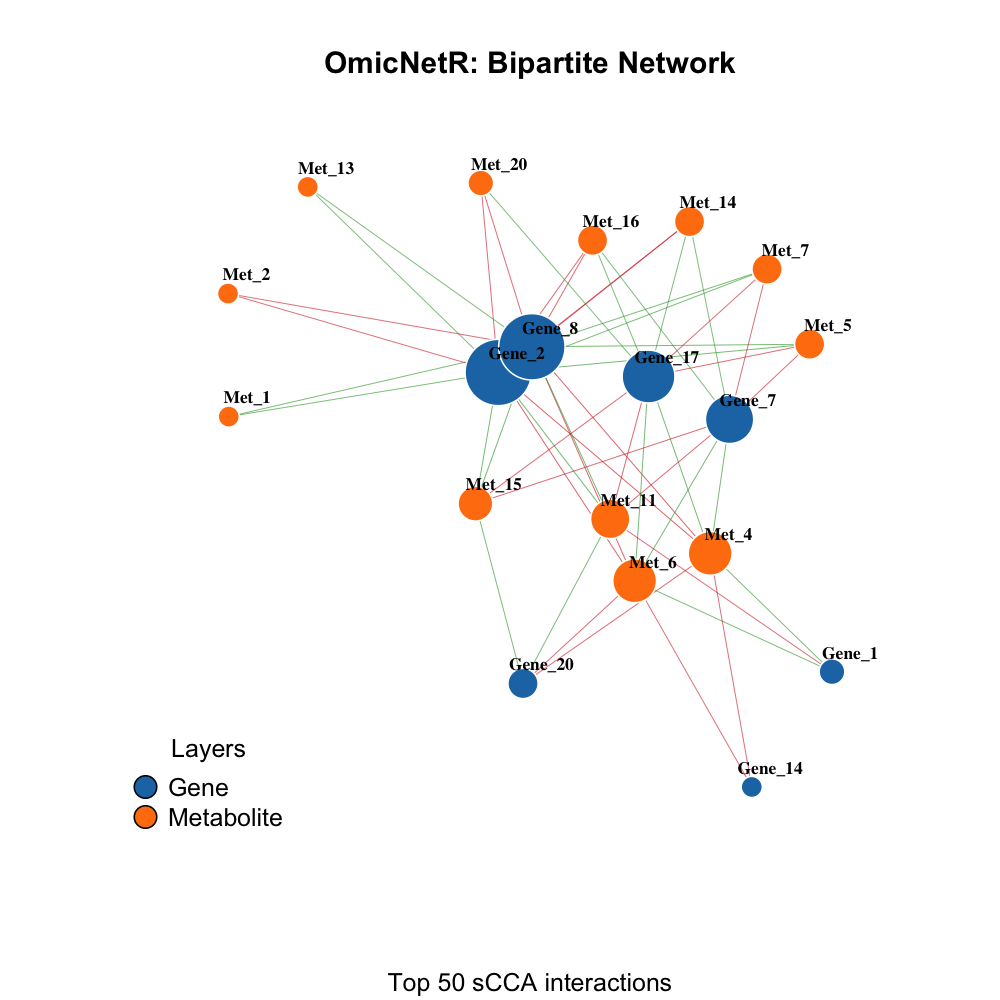
net_data <- head(net_data, 50)
Figures
The script tools/render_readme.R will (1) generate figures into
man/figures/ and (2) render README.md. If you already generated
figures, the blocks below will display them in GitHub.
Bipartite gene–metabolite network
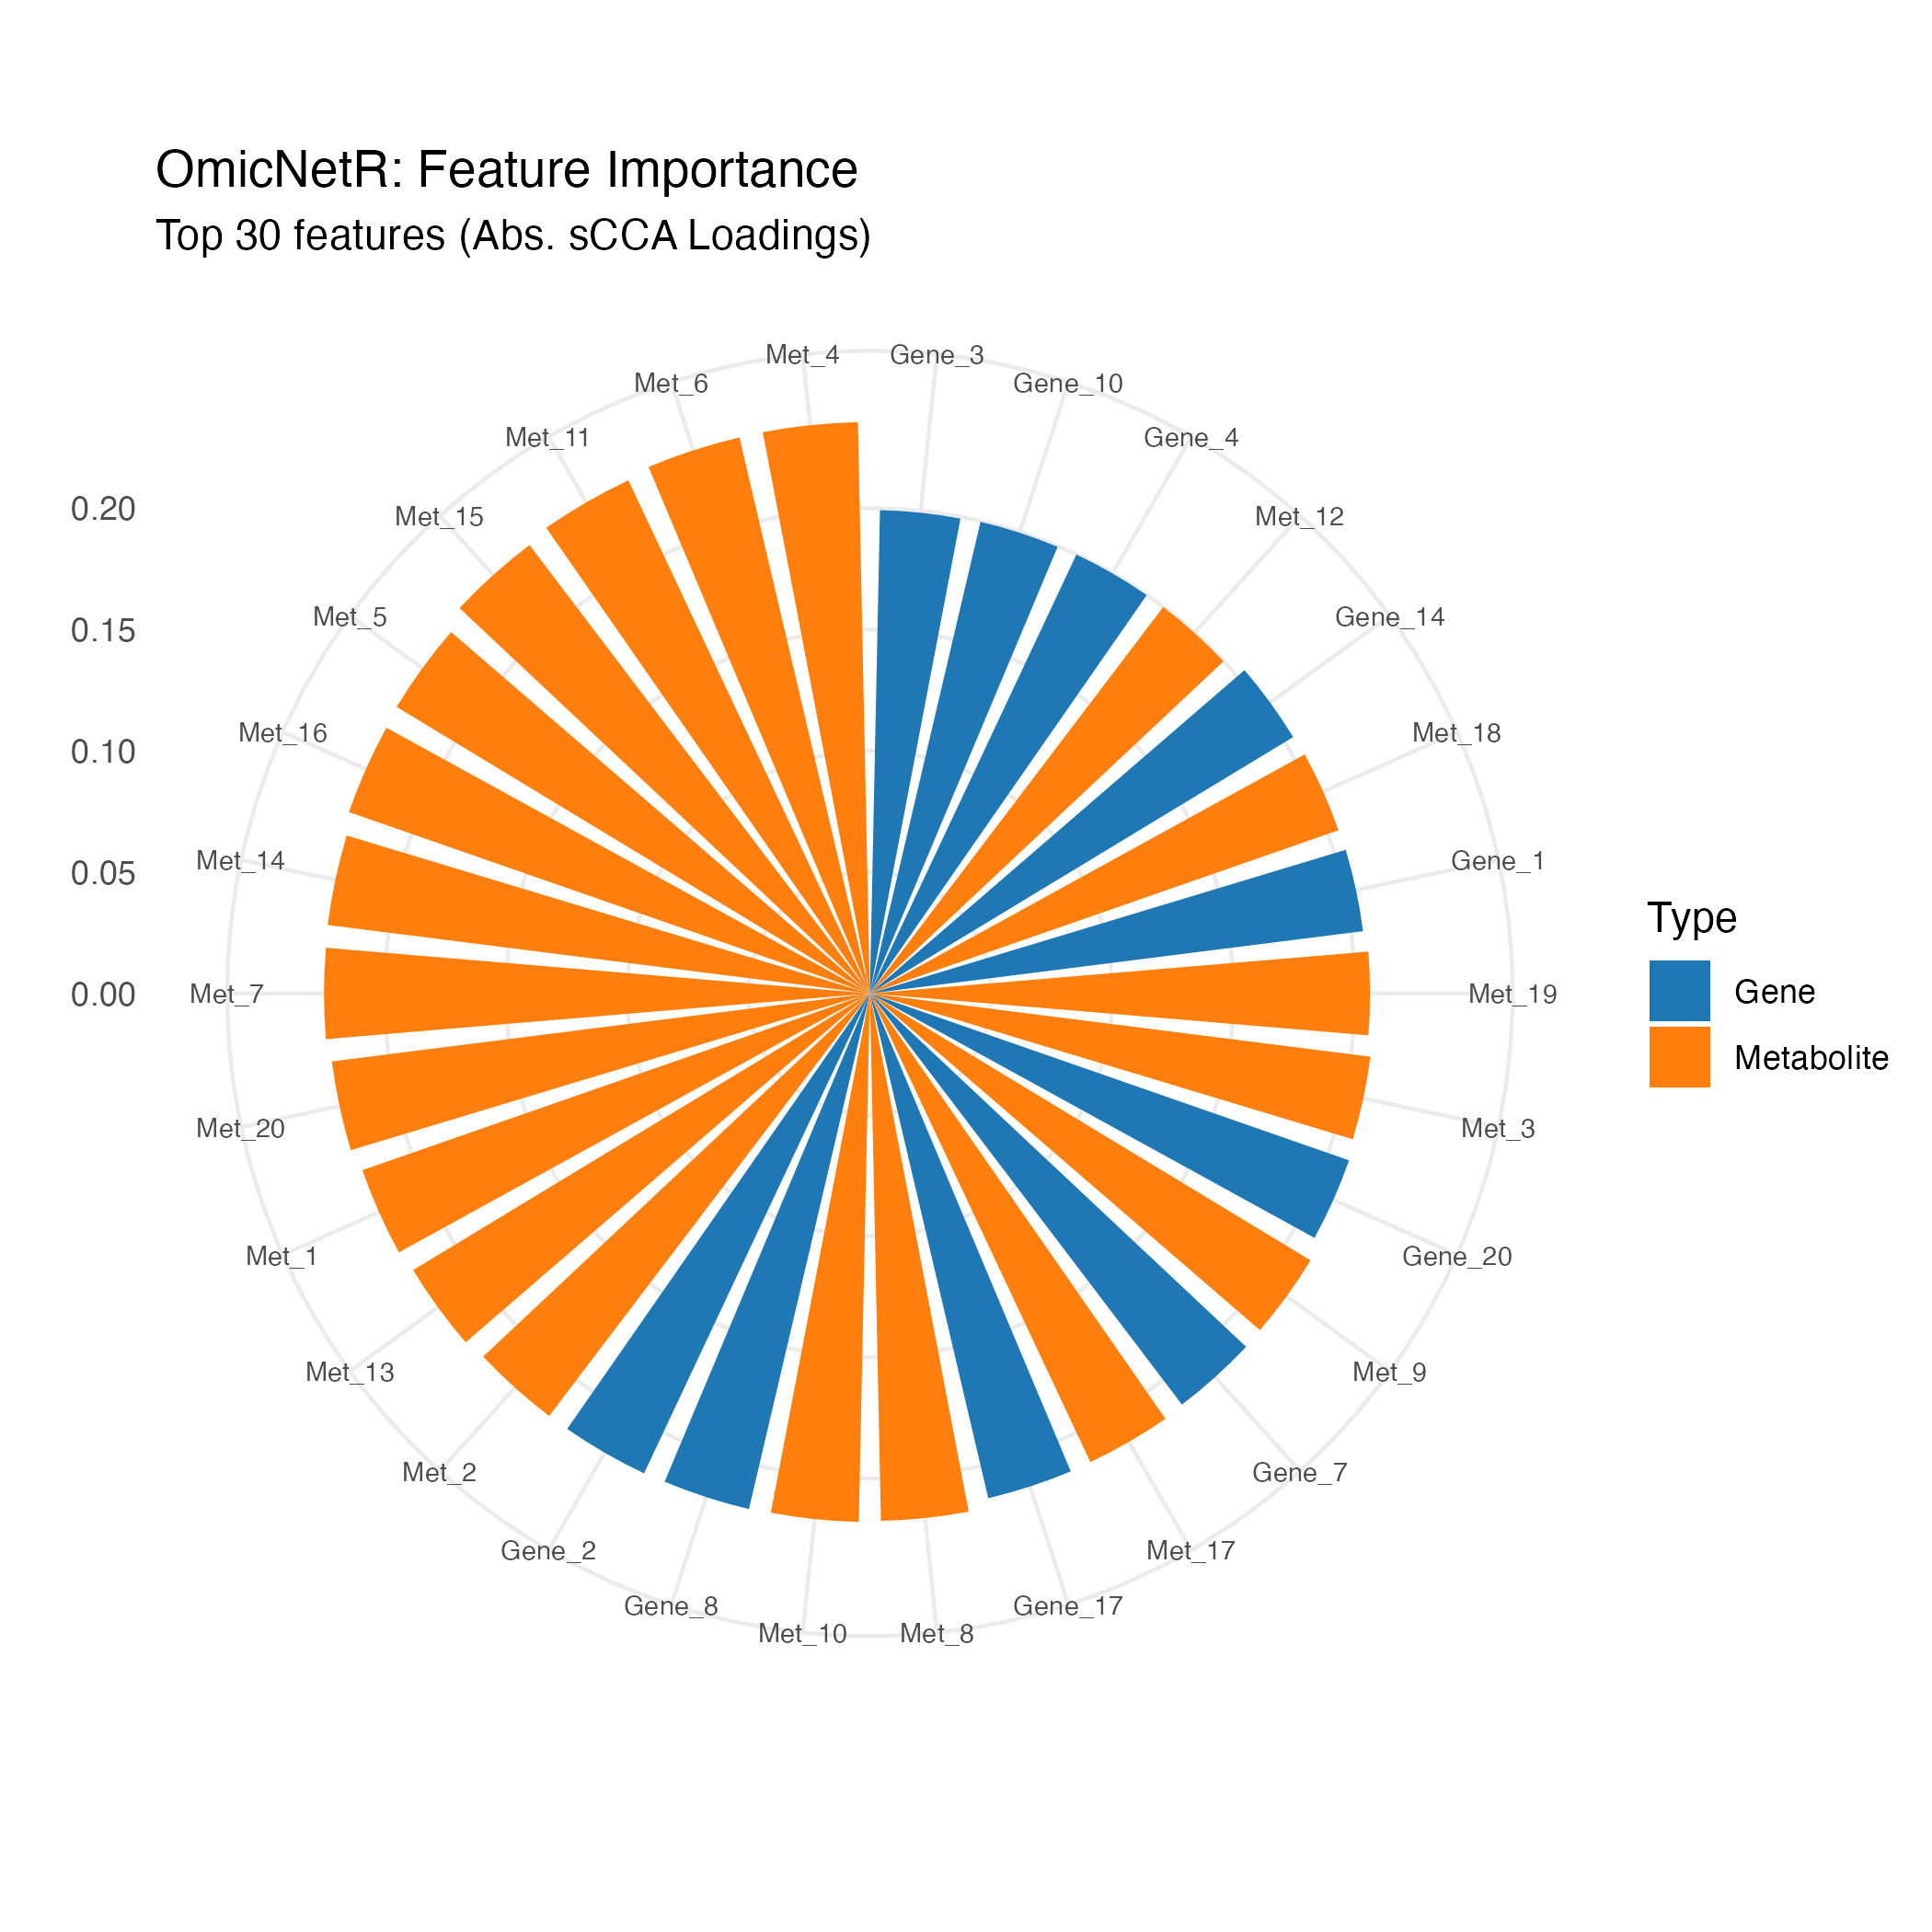
Feature importance circle plot
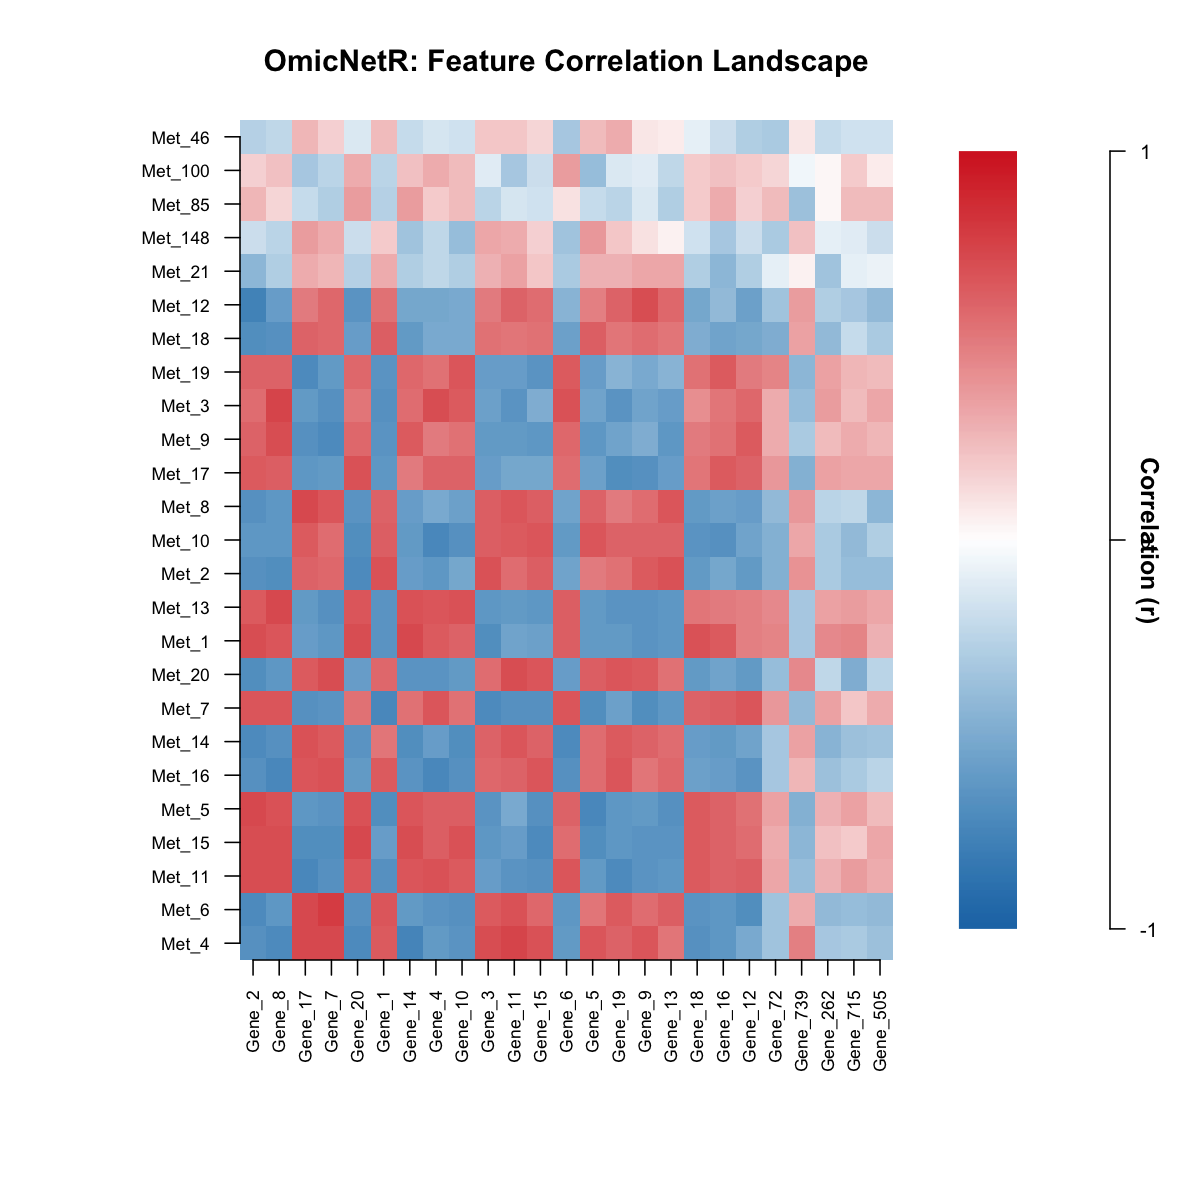
Gene–metabolite correlation heatmap
Included example dataset
data(omics_example)
str(omics_example, max.level = 1)
## List of 3
##  $ X       : num [1:50, 1:200] -1.6301 0.0816 -0.0224 -0.588 0.5384 ...
##   ..- attr(*, "dimnames")=List of 2
##   ..- attr(*, "scaled:center")= Named num [1:200] -0.0411 0.3266 -0.1829 0.015 -0.3237 ...
##   .. ..- attr(*, "names")= chr [1:200] "Gene_1" "Gene_2" "Gene_3" "Gene_4" ...
##   ..- attr(*, "scaled:scale")= Named num [1:200] 2.03 1.68 2.28 1.91 2.14 ...
##   .. ..- attr(*, "names")= chr [1:200] "Gene_1" "Gene_2" "Gene_3" "Gene_4" ...
##  $ Y       : num [1:50, 1:50] 0.279 -0.754 -1.271 1.383 0.084 ...
##   ..- attr(*, "dimnames")=List of 2
##   ..- attr(*, "scaled:center")= Named num [1:50] -0.1551 -0.1521 0.2014 -0.0142 0.2227 ...
##   .. ..- attr(*, "names")= chr [1:50] "Met_1" "Met_2" "Met_3" "Met_4" ...
##   ..- attr(*, "scaled:scale")= Named num [1:50] 2.39 2.27 2.26 2.38 2.24 ...
##   .. ..- attr(*, "names")= chr [1:50] "Met_1" "Met_2" "Met_3" "Met_4" ...
##  $ metadata:'data.frame':    50 obs. of  3 variables:
Note:
omics_exampleis simulated and intended for demonstration only.
Main functions
generate_dummy_omics()– generate linked synthetic multi-omics dataalign_omics()– align datasets by sample namesomic_scca()– perform sparse canonical correlation analysisscca_to_network()– convert sCCA loadings to network edgesplot_bipartite_network()– visualize gene–metabolite networksplot_pathway_circle()– feature importance radial plotplot_correlation_heatmap()– global correlation heatmap
Code of conduct
Please note that the OmicNetR project is released with a Contributor Code of Conduct. By contributing to this project, you agree to abide by its terms.