Gmisc
Descriptive Statistics, Transition Plots, and More
Utilities for common medical-statistics graphics and tables, including automatic creation of publication-ready "Table 1" summaries; transition (Sankey) plots; flow-chart helpers that extend the grid package; Bézier lines and arrows; and a singular-value-decomposition- based variable-selection method.
Gmisc

Gmisc collects utilities for the graphics and tables that recur in
medical research papers — built so they compose with the native R pipe
(|>):
- Descriptive “Table 1” —
getDescriptionStatsBy()+htmlTable()for publication-ready, copy-paste descriptive tables. - Grid-based flowcharts — a
flowchart() |> spread() |> move() |> connect()pipeline for CONSORT-style diagrams, includingphaseLabel()headings. - Transition plots — the
Transitionclass for visualising how observations move between categories over time. - SVD variable selection —
getSvdMostInfluential()for picking influential variables. - Bézier arrows — smooth arrows complementing the
gridpackage.
Installation
# From CRAN
install.packages("Gmisc")

# Development version from GitHub
# install.packages("remotes")
remotes::install_github("gforge/Gmisc")
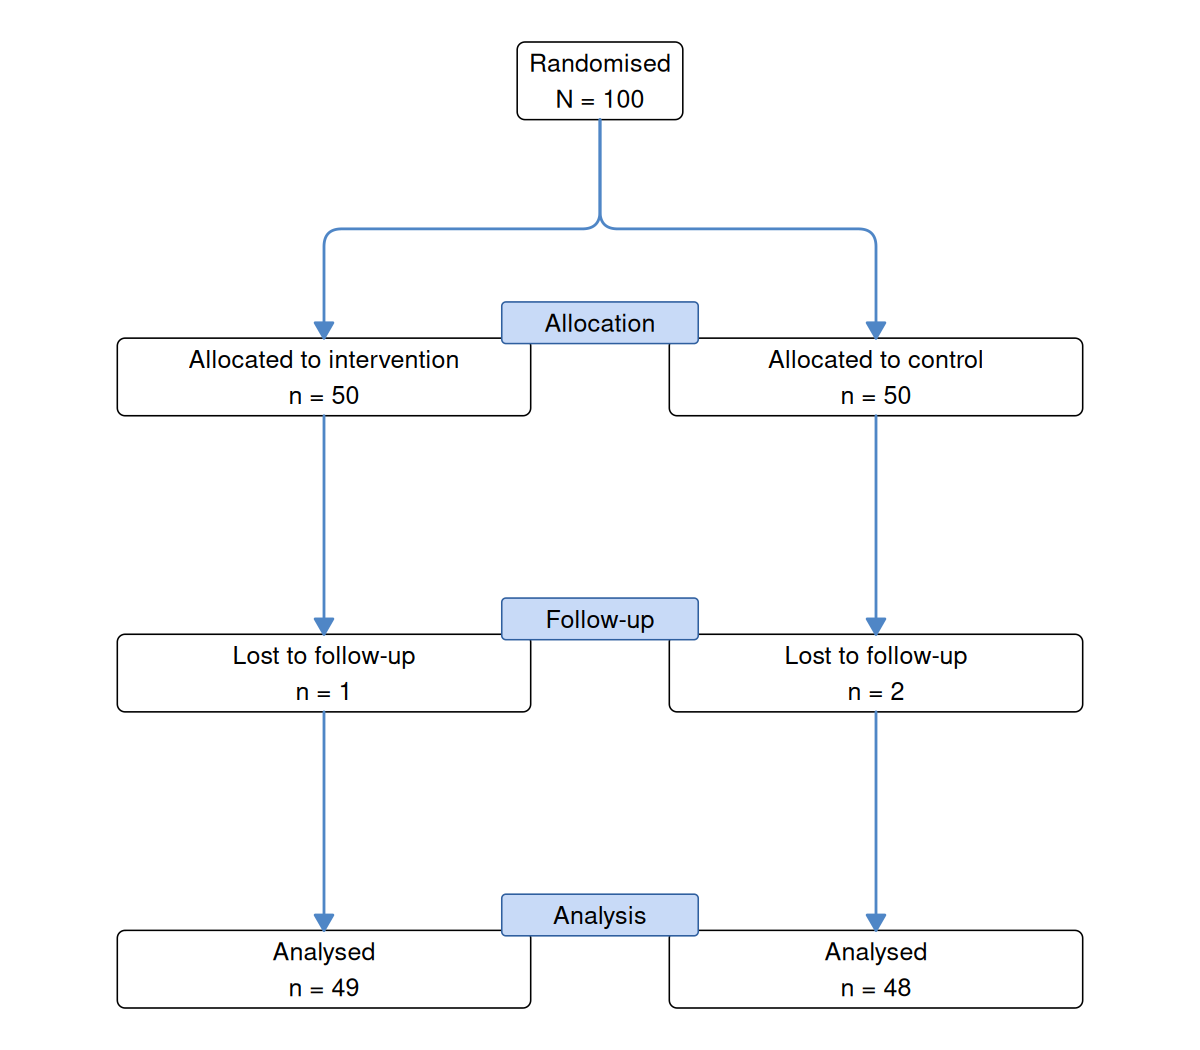
Flowcharts & CONSORT diagrams
Build a flowchart as a named list of boxes, position the columns with
spread()/move(), then add the connectors. Parallel arms are just
lists, and phaseLabel() drops a CONSORT phase heading (“Allocation”,
“Follow-up”, …) between the arms — centred, slightly overlapping, and
drawn on top.
library(Gmisc)
library(grid)

main_gp <- gpar(fill = "white", col = "black", lwd = 1)
head_gp <- gpar(fill = "#c8daf7", col = "#2f5f9f", lwd = 1)
con_gp  <- gpar(col = "#4f86c6", fill = "#4f86c6", lwd = 1.8)
sw      <- unit(70, "mm")

flowchart(
  rando = boxGrob("Randomised\nN = 100", box_gp = main_gp),
  groups = list(
    boxGrob("Allocated to intervention\nn = 50", width = sw, box_gp = main_gp),
    boxGrob("Allocated to control\nn = 50", width = sw, box_gp = main_gp)
  ),
  followup = list(
    boxGrob("Lost to follow-up\nn = 1", width = sw, box_gp = main_gp),
    boxGrob("Lost to follow-up\nn = 2", width = sw, box_gp = main_gp)
  ),
  analysis = list(
    boxGrob("Analysed\nn = 49", width = sw, box_gp = main_gp),
    boxGrob("Analysed\nn = 48", width = sw, box_gp = main_gp)
  )
) |>
  spread(axis = "y", margin = unit(0.04, "npc")) |>
  move(subelement = list(c("groups", 1), c("followup", 1), c("analysis", 1)), x = 0.27) |>
  move(subelement = list(c("groups", 2), c("followup", 2), c("analysis", 2)), x = 0.73) |>
  phaseLabel("groups",   "Allocation", box_gp = head_gp) |>
  phaseLabel("followup", "Follow-up",  box_gp = head_gp) |>
  phaseLabel("analysis", "Analysis",   box_gp = head_gp) |>
  connect("rando",    "groups",   type = "N", lty_gp = con_gp, arrow_size = 3, smooth = TRUE) |>
  connect("groups",   "followup", type = "v", lty_gp = con_gp, arrow_size = 3) |>
  connect("followup", "analysis", type = "v", lty_gp = con_gp, arrow_size = 3)
See vignette("Grid-based_flowcharts", package = "Gmisc") for the full
API.
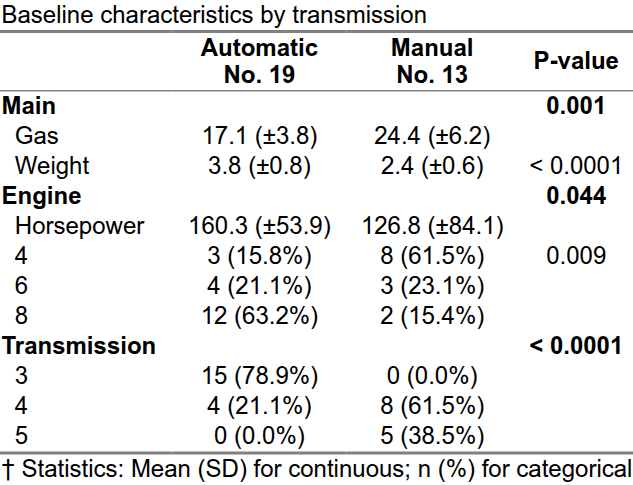
Descriptive “Table 1”
getDescriptionStatsBy() summarises variables split by a grouping
column. It is often used with mergeDesc() to group related variables
into sections, and pipes straight into htmlTable() for a
publication-ready table.
library(dplyr)
library(Gmisc)
# A custom wrapper to keep statistics and formatting consistent
# (e.g., same digits, p-values, and header count)
get_stats <- function(data, ...) {
res <- data |>
getDescriptionStatsBy(...,
by = am,
statistics = TRUE,
digits = 1,
header_count = TRUE)
if (is.list(res)) {
return(do.call(rbind, res))
}
return(res)
}
mtcars_prep <- mtcars |>
mutate(am = factor(am, labels = c("Automatic", "Manual")),
gear = factor(gear),
cyl = factor(cyl)) |>
set_column_labels(mpg = "Gas",
wt = "Weight",
hp = "Horsepower",
cyl = "Cylinders",
gear = "Gears") |>
set_column_units(mpg = "Miles/gallon",
wt = "10<sup>3</sup> lbs",
hp = "hp")
# Group variables and merge them into a single table
mergeDesc(
"Main" = mtcars_prep |> get_stats(mpg, wt),
"Engine" = mtcars_prep |> get_stats(hp, cyl),
"Transmission" = mtcars_prep |> get_stats(gear)
) |>
htmlTable(caption = "Baseline characteristics by transmission",
tfoot = "† Statistics: Mean (SD) for continuous; n (%) for categorical")
See vignette("Descriptives", package = "Gmisc") for the many
formatting options.
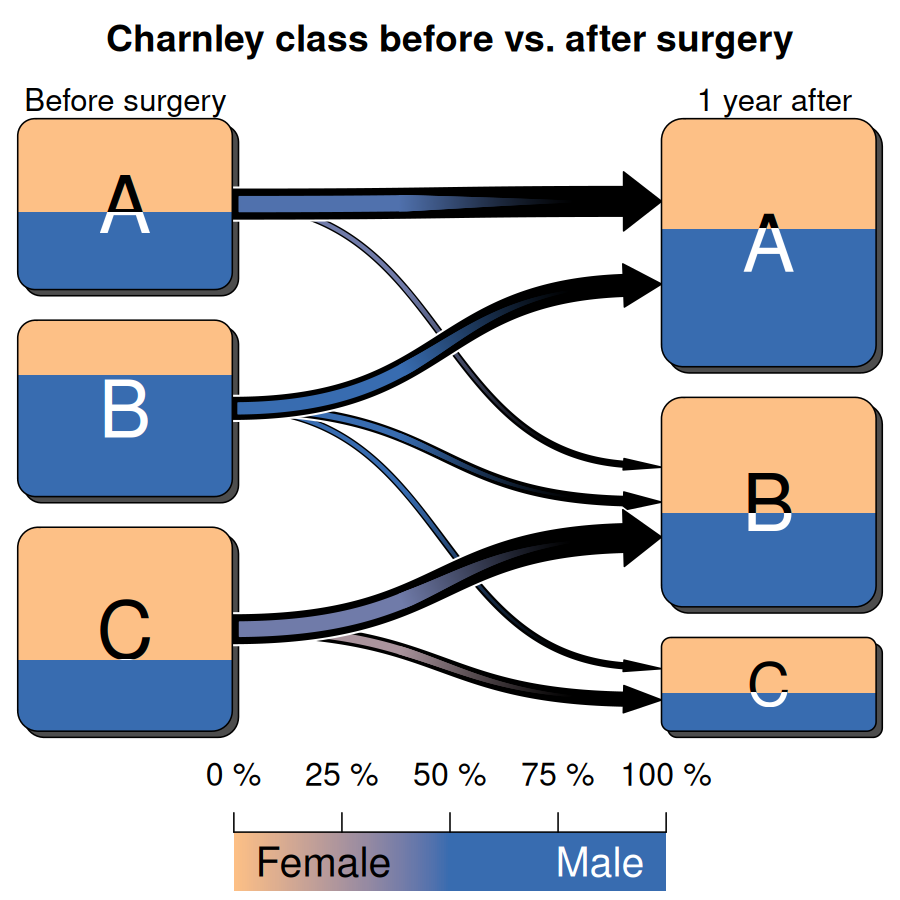
Transition plots
The Transition class shows how observations move between classes over
time; a third dimension can be encoded as a colour split within each
box.
set.seed(1)
n <- 100
sex    <- sample(c("Male", "Female"), n, replace = TRUE)
before <- sample(1:3, n, replace = TRUE)
# Most cases improve one class, some stay, a few worsen
after  <- pmin(pmax(before - sample(c(-1, 0, 1), n, replace = TRUE, prob = c(.15, .35, .5)), 1), 3)

lbl <- c("A", "B", "C")
tbl <- table(factor(before, 1:3, lbl), factor(after, 1:3, lbl), sex)

transitions <- getRefClass("Transition")$new(tbl, label = c("Before surgery", "1 year after"))
transitions$title   <- "Charnley class before vs. after surgery"
transitions$clr_bar <- "bottom"
transitions$render()
See vignette("Transition-class", package = "Gmisc") for customisation.
Learn more
- Project page: https://gforge.se
- Vignettes:
browseVignettes("Gmisc") - Bugs & feature requests: https://github.com/gforge/Gmisc/issues