rpivotTable
Build Powerful Pivot Tables and Dynamically Slice & Dice your Data
Build powerful pivot tables (aka Pivot Grid, Pivot Chart, Cross-Tab) and dynamically slice & dice / drag 'n' drop your data. 'rpivotTable' is a wrapper of 'pivottable', a powerful open-source Pivot Table library implemented in 'JavaScript' by Nicolas Kruchten. Aligned to 'pivottable' v2.19.0.
rpivotTable: pivottable for R


This package is derived from Enzo Martoglio’s original rpivotTable, released under the MIT license.
The rpivotTable package is an R htmlwidget visualization library built around the Javascript pivottable library.
PivotTable.js is a Javascript Pivot Table library with drag’n’drop functionality built on top of jQuery/jQueryUI and written in CoffeeScript (then compiled to JavaScript) by Nicolas Kruchten at Datacratic. It is available under an MIT license
Installation
The rpivotTable package depends on htmlwidgets package so you need to install both packages. You can do this using the pak package as follows:
pak::pak(c("ramnathv/htmlwidgets", "IDEMSInternational/rpivotTable"))
Usage
Call the package with
library(rpivotTable) # No need to explicitly load htmlwidgets: this is done automatically
Just plug in your data.frame or data.table (e.g. dt) to
rpivotTable().
It is as simple as this:
data(mtcars)
rpivotTable(mtcars)
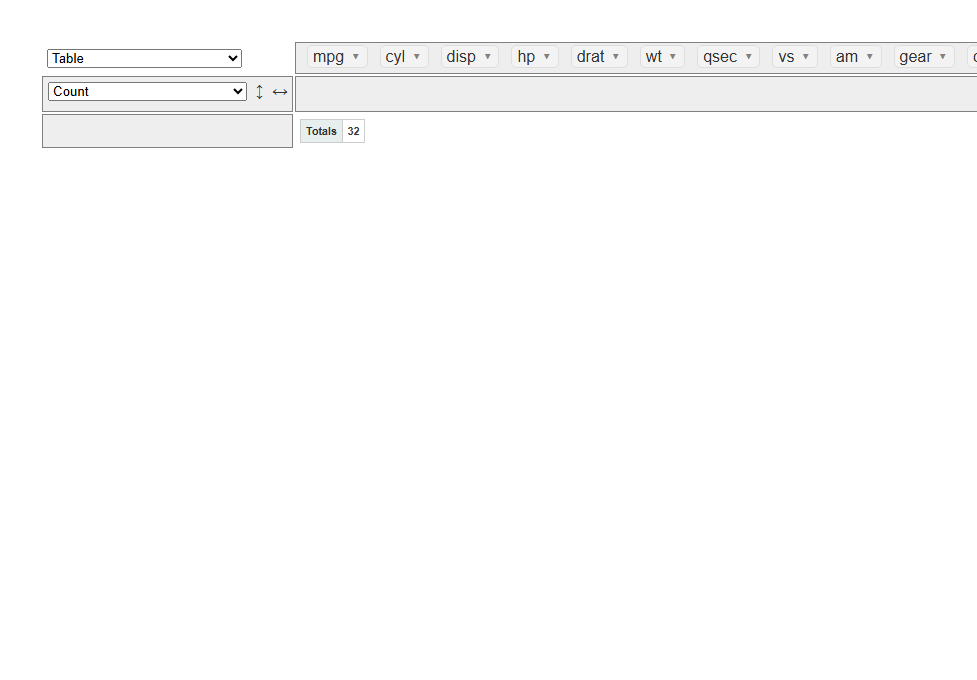
The pivot table should appear in your RStudio Viewer or your browser of choice.
Please refer to the examples and explanations here.
rpivotTable parameters decide how the pivot table will look like the
firs time it is opened:
datacan be adata.frameordata.table. Nothing else is needed. If only the data is selected the pivot table opens with nothing on rows and columns (but you can at any time drag and drop any variable in rows or columns at your leasure)rowsandcolsallow the user to create a report, i.e. to indicate which element will be on rows and columns.aggregatorNameindicates the type of aggregation. Options here are numerous: Count, Count Unique Values, List Unique Values, Sum, Integer Sum, Average, Sum over Sum, 80% Upper Bound, 80% Lower Bound, Sum as Fraction of Total, Sum as Fraction of Rows, Sum as Fraction of Columns, Count as Fraction of Total, Count as Fraction of Rows, Count as Fraction of Columnsvalsspecifies the variable to use withaggregatorName.renderersdictates the type of graphic element used for display, like Table, Treemap etc.sortersallow to implement a javascript function to specify the ad hoc sorting of certain values. See vignette for an example. It is especially useful with time divisions like days of the week or months of the year (where the alphabetical order does not work)subtotalswill allow to dynamically select / deselect subtotals
For example, to display a pivot table with frequency of colour combinations of eyes and hair, you can specify:
data(HairEyeColor)
rpivotTable(data = HairEyeColor, rows = "Hair",cols="Eye", vals = "Freq", aggregatorName = "Sum", rendererName = "Table", width="100%", height="400px")
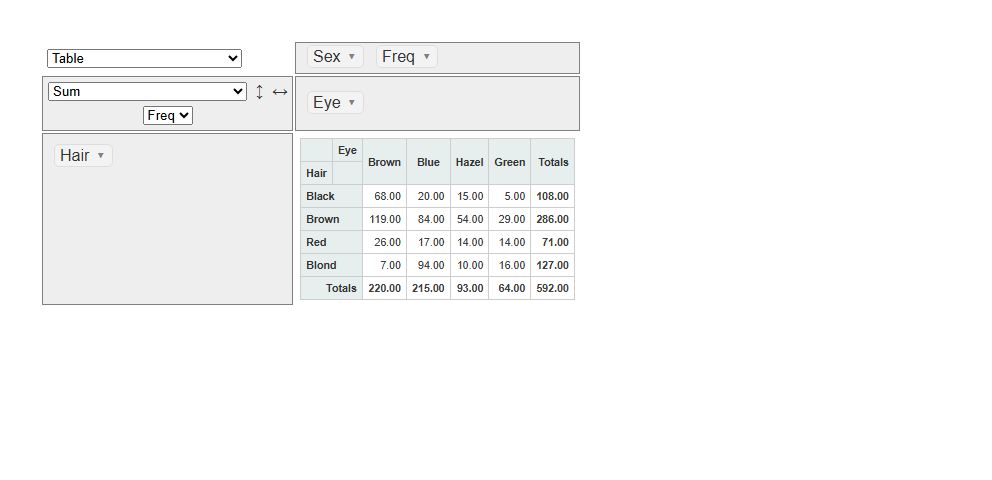
This will display a cross tab with the frequency of eyes by hair colour. Dragging & dropping (slicing & dicing) categorical variables in rows and columns changes the shape of the table.
If you want to include it as part of your dplyr / magrittr pipeline,
you can do that also:
library(dplyr)
#> Warning: package 'dplyr' was built under R version 4.4.3
#>
#> Attaching package: 'dplyr'
#> The following objects are masked from 'package:stats':
#>
#>     filter, lag
#> The following objects are masked from 'package:base':
#>
#>     intersect, setdiff, setequal, union
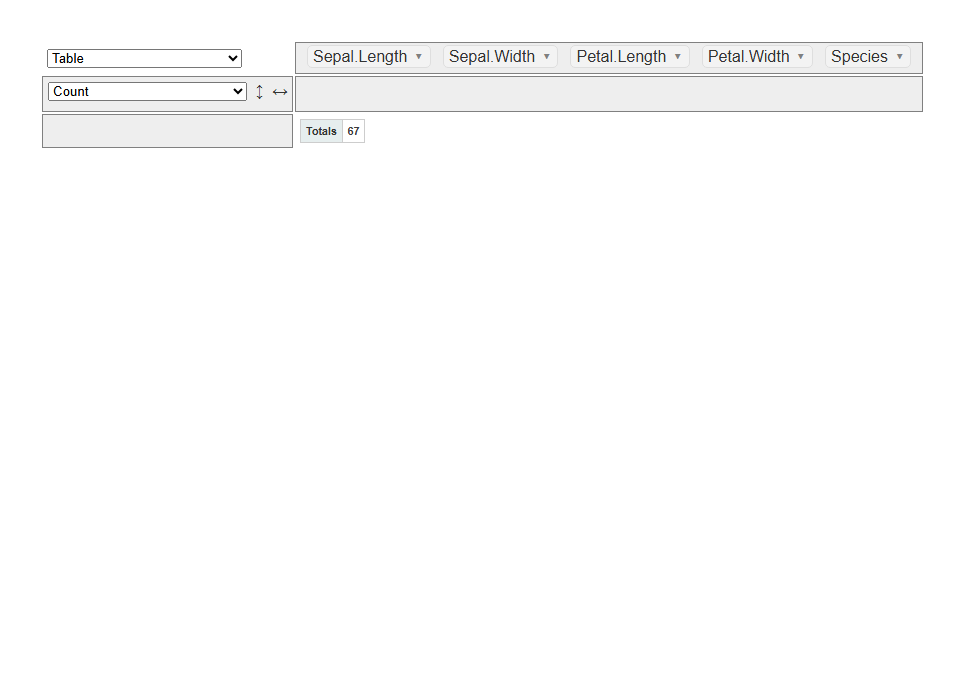
iris %>%
  filter( Sepal.Width > 3 ) %>%
  rpivotTable()
Latest news
Version 0.4.0: IDEMS International has forked and taken over as
maintainer. rpivotTable() now automatically sorts rows/columns for
factor variables by their factor level order (instead of
alphabetically), generating the sorters JavaScript itself from data
— pass your own sorters argument to override this default. Various
fixes for CRAN resubmission.