qbinplots
Quantile Binned Plots
Create quantile binned and conditional plots for Exploratory Data Analysis. The package provides several plotting functions that are all based on quantile binning. The plots are created with 'ggplot2' and 'patchwork' and can be further adjusted.
qbinplots


This package creates plots using quantile binning. Quantile binning is an exploratory data analysis tool that helps to see the distribution of the variables in a dataset as a function of the variable that is binned.
Installation
You can install the development version of qbinplots from
GitHub with:
remotes::install_github("edwindj/qbinplots")
Example
library(qbinplots)
## basic example code
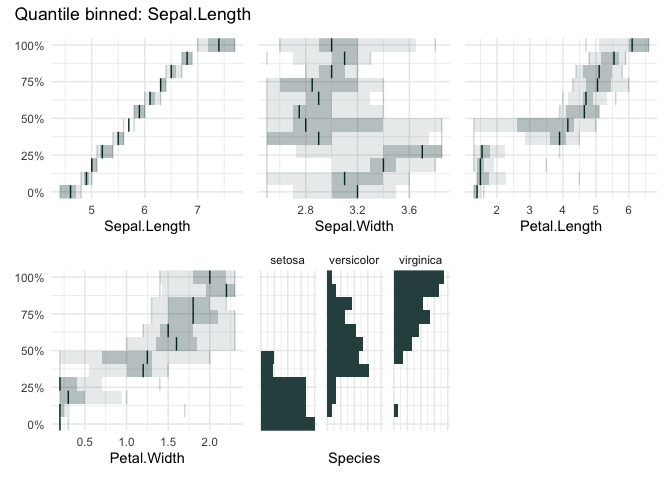
A quantile binning boxplot
qbin_boxplot(iris, "Sepal.Length", n = 12)
vs
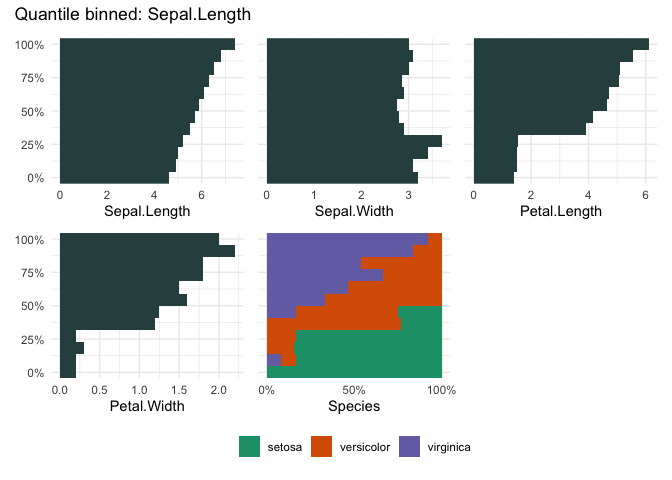
A quantile binning barplot
qbin_barplot(iris, "Sepal.Length", n = 12)
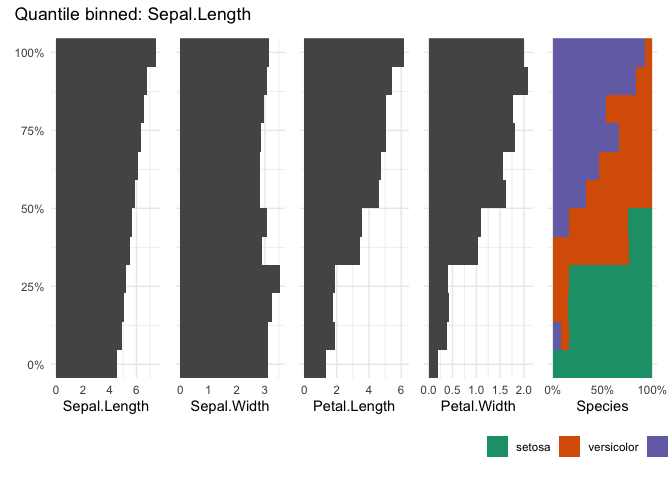
table_plot(iris, "Sepal.Length", n=12)
vs
A quantile binning heatmap
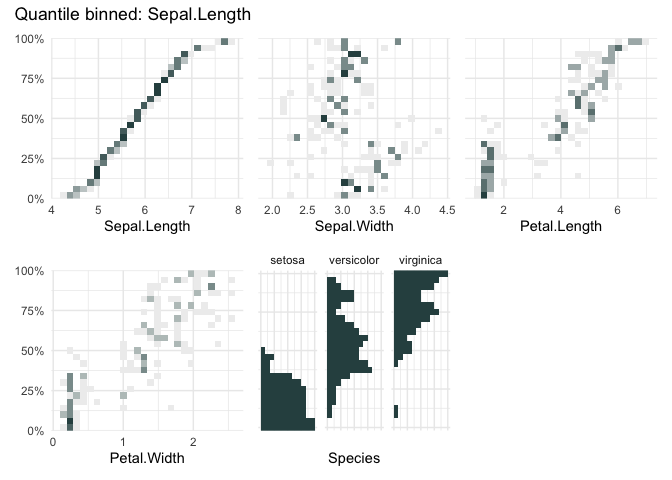
qbin_heatmap(iris, "Sepal.Length", n=12, auto_fill = TRUE)
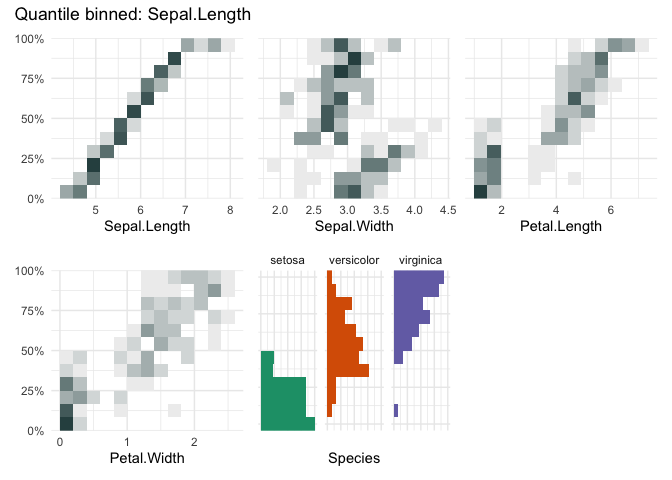
cond_boxplot(iris, "Sepal.Length", n=12, auto_fill = TRUE)
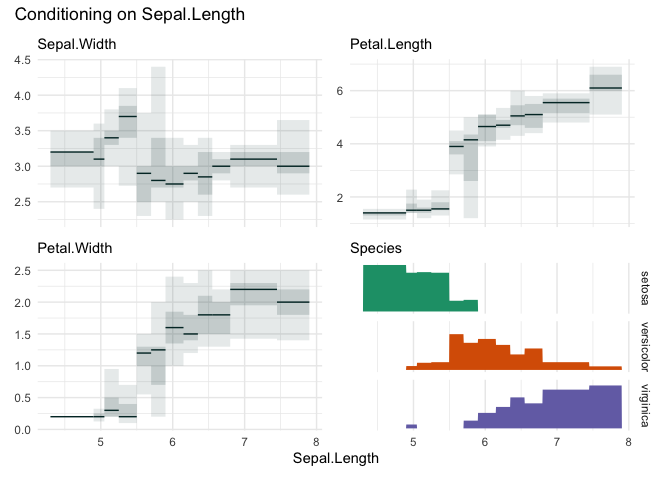
cond_barplot(iris, "Sepal.Length", n=12, auto_fill = TRUE)
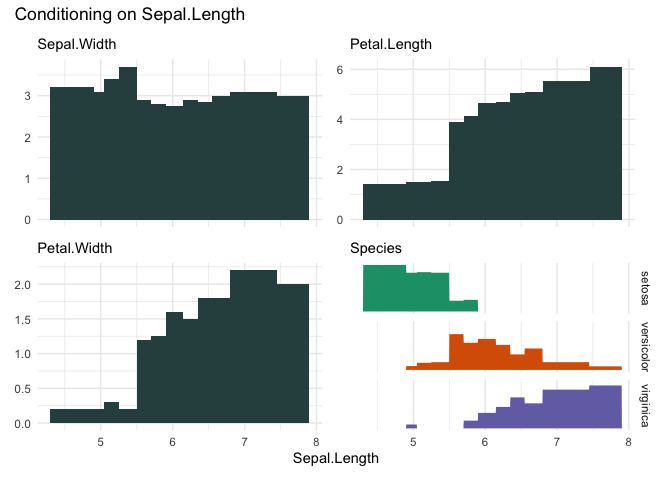
funq_plot(iris, "Sepal.Length", 12, auto_fill = TRUE)
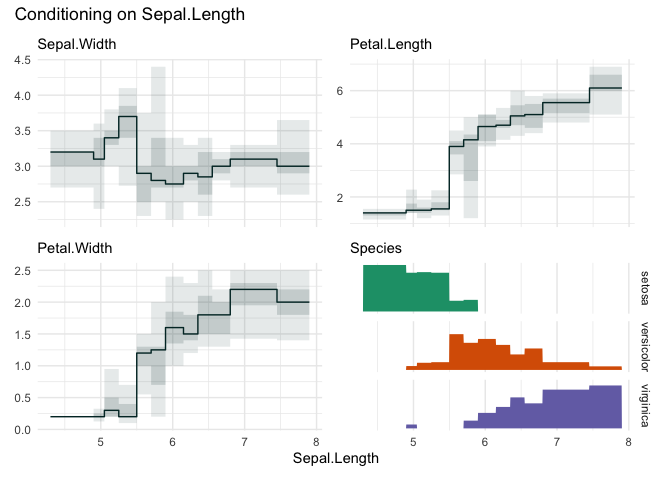
funq_plot(iris, "Sepal.Length", overlap = TRUE, min_bin_size = 20)
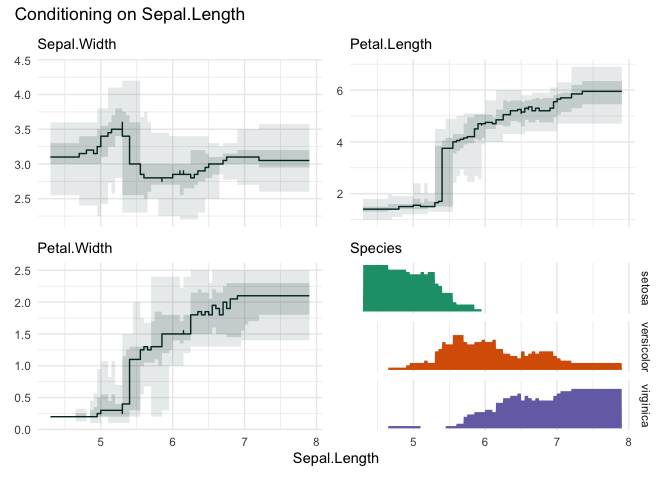
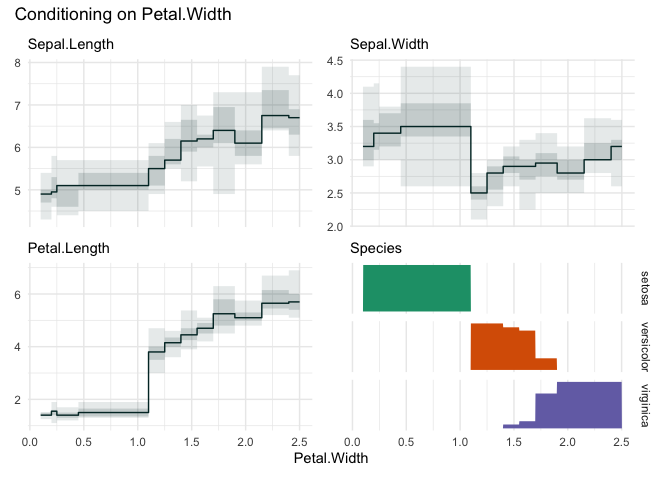
Choosing “Petal.Width”
funq_plot(iris, "Petal.Width", n=12)
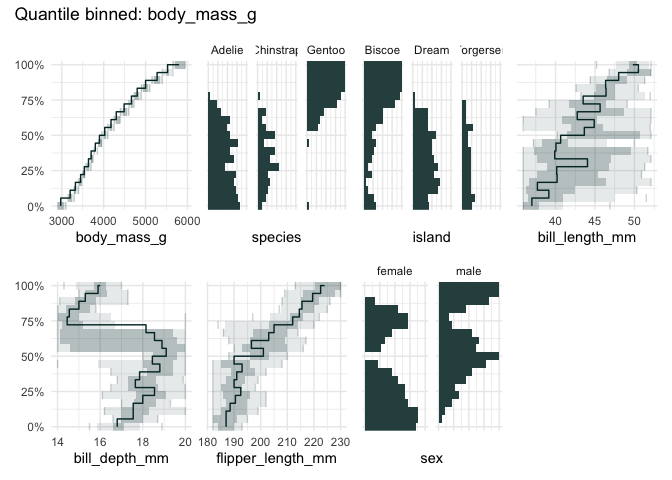
library(palmerpenguins)
qbin_lineplot(penguins[1:7], x="body_mass_g", n = 19, ncols = 4)
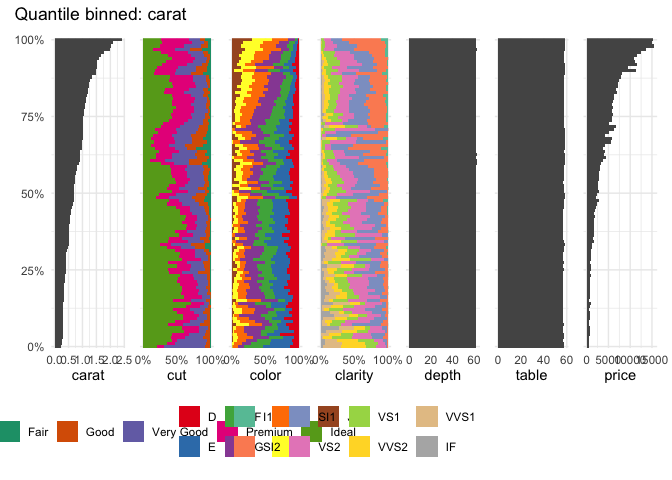
Or the well-known diamonds dataset
data("diamonds", package = "ggplot2")
table_plot(diamonds[1:7], "carat")
data("diamonds", package = "ggplot2")
qbin_boxplot(diamonds[1:7], "carat")
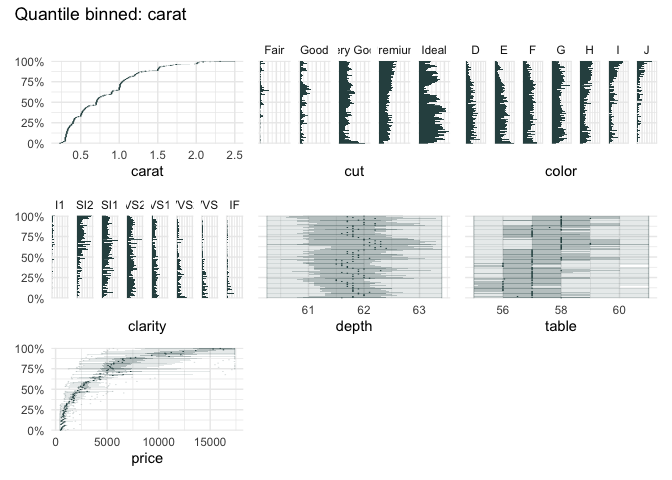
funq_plot(diamonds[1:7], "carat")
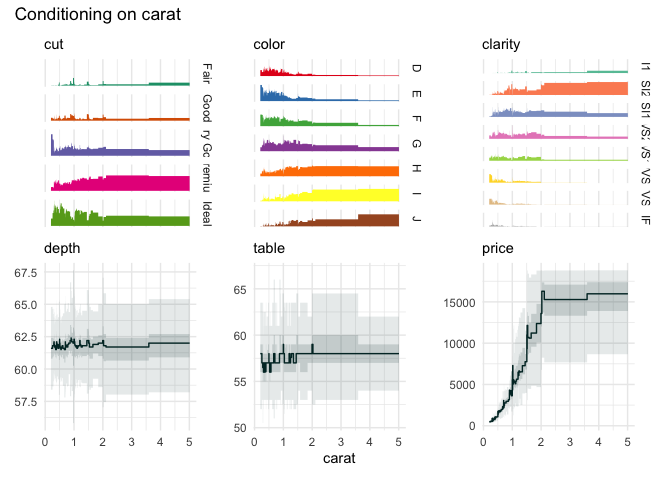
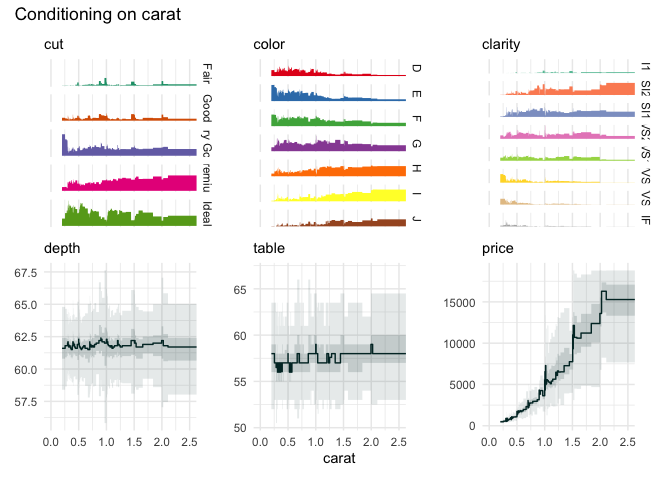
We can zoom in on the carat variable, because the upper quantile bins
are not very informative.
funq_plot(
  diamonds[1:7],
  "carat",
  auto_fill = TRUE,
  xlim = c(0, 2.5)
)
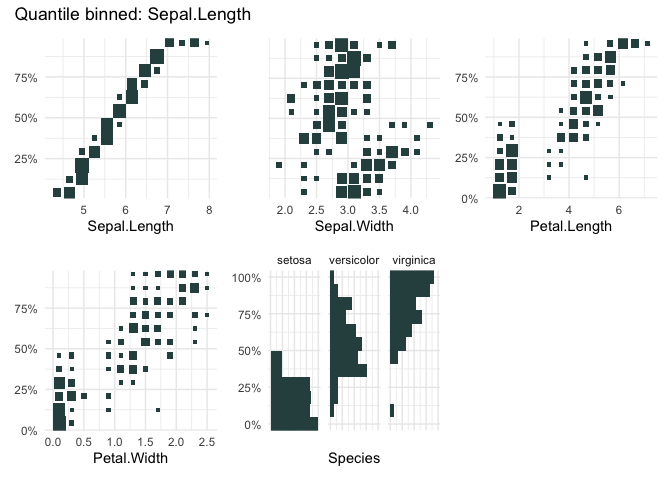
qbin_heatmap(
  iris,
  x = "Sepal.Length",
  n = 12,
  type="s"
)
qbin_heatmap(
  iris,
  x = "Sepal.Length",
  overlap = TRUE
)