paar
Precision Agriculture Data Analysis
Precision agriculture spatial data
depuration and homogeneous zones (management zone) delineation.
The package includes functions that performs protocols for data cleaning
management zone delineation and zone comparison; protocols are described in
Paccioretti et al., (2020)
paar 



The goal of paar is to provide useful tools for cleaning and
processing spatial data in precision agriculture.
Installation
You can install the released version of paar from CRAN with:
install.packages("paar")
You can install the development version from GitHub with:
# install.packages("pak")
pak::pkg_install("PPaccioretti/paar")
Example
The package provides a complete protocol for automated error removal. Default values of all functions are optimized for precision agriculture data.
library(paar)
library(sf)
#> Warning: package 'sf' was built under R version 4.5.2
data("barley", package = 'paar')
The barley dataset contains grain yield data collected were using
calibrated commercial yield monitors, mounted on combines equipped with
DGPS.
#Convert barley data to an spatial object
barley_sf <- st_as_sf(barley, coords = c("X", "Y"), crs = 32720)

barley_dep <-
  depurate(barley_sf, "Yield")
#> Concave hull algorithm is computed with
#> concavity = 2 and length_threshold = 0

# Summary of depurated data
summary(barley_dep)
#>       normal point             border spatial outlier MP spatial outlier LM
#>         5673 (77%)          964 (13%)         343 (4.6%)         309 (4.2%)
#>         global min            outlier
#>          99 (1.3%)         6 (0.081%)
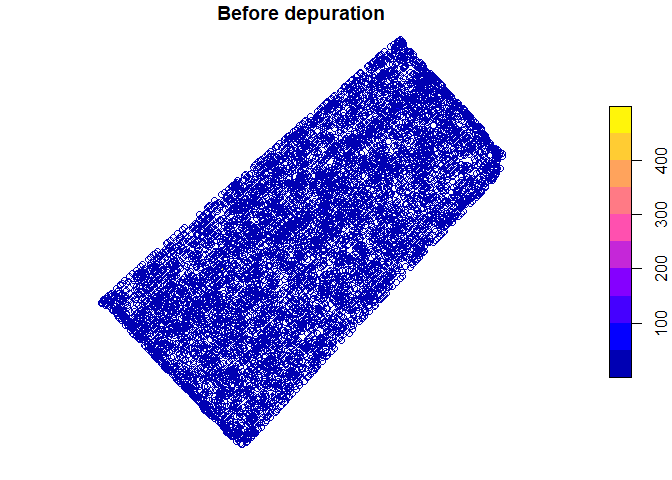
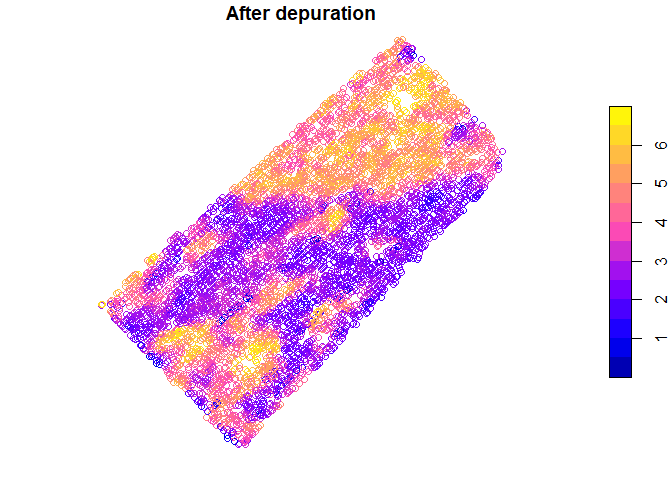
Spatial yield values before and after the depuration process can be visualized
plot(barley_sf["Yield"], main = "Before depuration")
plot(barley_dep$depurated_data["Yield"], main = "After depuration")
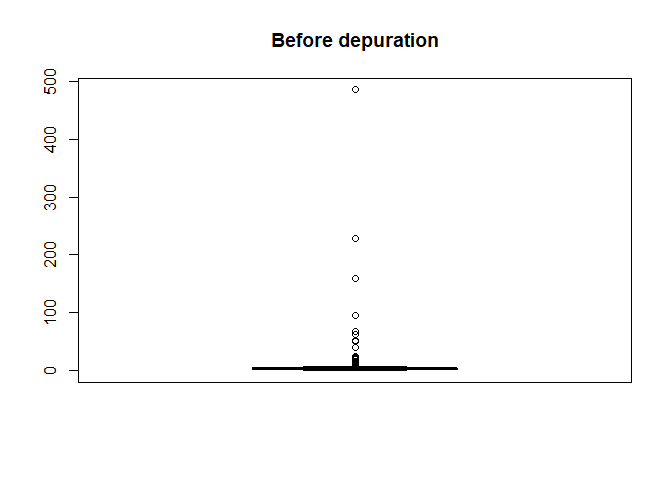
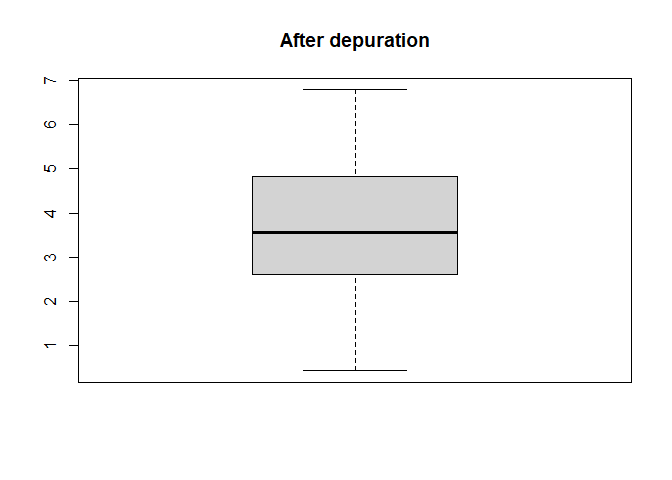
The distribution of yield values can also be compared
boxplot(barley_sf[["Yield"]], main = "Before depuration")
boxplot(barley_dep$depurated_data[["Yield"]], main = "After depuration")
References
- Vega, A., Córdoba, M., Castro-Franco, M. et al. (2019). Protocol for automating error removal from yield maps. Precision Agric 20, 1030–1044 https://doi.org/10.1007/s11119-018-09632-8
- Paccioretti, P., Córdoba, M., & Balzarini, M. (2020). FastMapping: Software to create field maps and identify management zones in precision agriculture. Computers and Electronics in Agriculture, 175, 105556 https://doi.org/10.1016/j.compag.2020.105556.