leri
Access Landscape Evaporative Response Index Raster Data
Finds and downloads Landscape Evaporative Response Index (LERI) data, then reads the data into 'R' using the 'raster' package. The LERI product measures anomalies in actual evapotranspiration, to support drought monitoring and early warning systems. More info on LERI is available at < https://www.esrl.noaa.gov/psd/leri/>.
leri: R package for the NOAA Landscape Evaporative Response Index


The leri R package facilitates access to the NOAA Landscape Evaporative Response Index data product.
Installation
You can install the development version of leri with devtools:
# install.packages("devtools")
devtools::install_github("earthlab/leri")
Example
The LERI product is available from the year 2000 to present at a 1 km spatial resolution over the continental United States, at the following timescales:
- 1, 3, 7, and 12 month
- 8 day accumulated or non-accumulated during the growing season (April - Oct.)
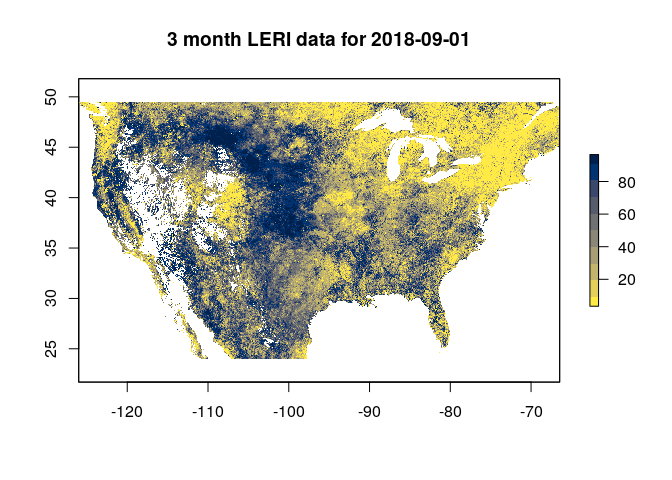
If we were interested in medium term drought, we could get 3 month timescale LERI data for a particular date as follows:
library(leri)
r <- get_leri(date = "2018-09-01", product = "3 month")
#> Loading required namespace: ncdf4
r
#> class      : RasterLayer
#> dimensions : 2844, 6617, 18818748  (nrow, ncol, ncell)
#> resolution : 0.009, 0.009  (x, y)
#> extent     : -126.009, -66.456, 23.949, 49.545  (xmin, xmax, ymin, ymax)
#> crs        : +init=epsg:4326 +proj=longlat +datum=WGS84 +no_defs +ellps=WGS84 +towgs84=0,0,0
#> source     : memory
#> names      : LERI_03mn_20180901.nc
#> values     : 3.448276, 96.55172  (min, max)
The get_leri function will download the NetCDF files from the NOAA ftp
server and read them as RasterStack objects, which facilitates any
other operations that users may need via the raster package. For
example, we could plot the data using the raster::plot function:
library(raster)
#> Loading required package: sp
library(viridis)
#> Loading required package: viridisLite

plot(r, col = cividis(10, direction = -1),
     main = "3 month LERI data for 2018-09-01")
LERI Resources
More information on the creation and recommended usage for LERI can be found here: https://www.esrl.noaa.gov/psd/leri/
Other potentially useful resources include: