ggstudent
Continuous Confidence Interval Plots using t-Distribution
Provides an extension to 'ggplot2'
(Wickham, 2016,
ggstudent - Continuous Confidence Interval Plots using t-Distribution
The R package ggstudent provides an extension to ggplot2 for creating two
types of continuous confidence interval plots (Violin CI and Gradient CI plots),
typically for the sample mean. These plots contain multiple user-defined confidence
areas with varying colours, defined by the underlying t-distribution used to compute
standard confidence intervals for the mean of the normal distribution when the variance is unknown.
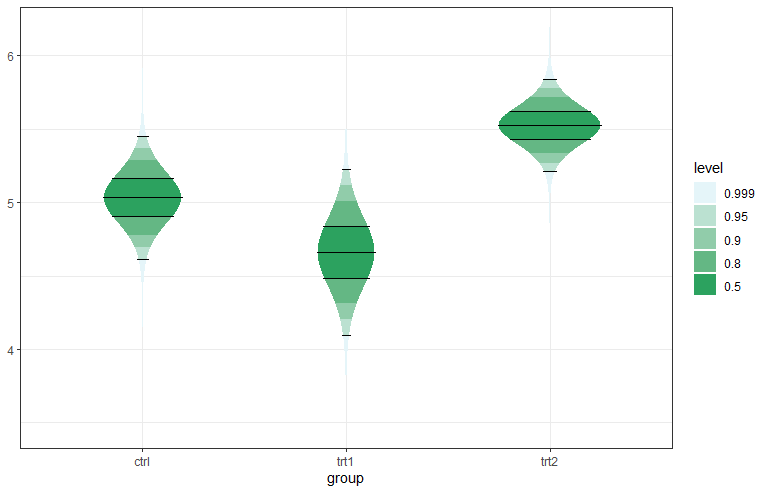
Two types of plots are available, a gradient plot with rectangular areas, and a violin plot where the shape (horizontal width) is defined by the probability density function of the t-distribution.
Note that these (and much more) is available also in the ggdist package.
See also the related paper and repository.
Here is an example:
library("magrittr")
library("dplyr")
library("ggplot2")
library("scales")

ci_levels <- c(0.999, 0.95, 0.9, 0.8, 0.5)
n <- length(ci_levels)
ci_levels <- factor(ci_levels, levels = ci_levels)
PlantGrowth %>% dplyr::group_by(group) %>%
  dplyr::summarise(
    mean = mean(weight),
    df = dplyr::n() - 1,
    se = sd(weight)/sqrt(df + 1)) %>%
 dplyr::full_join(
   data.frame(group =
     rep(levels(PlantGrowth$group), each = n),
     level = ci_levels), by = "group") -> d

p <- ggplot(data = d, aes(group)) +
 geom_student(aes(mean = mean, se = se, df = df,
   level = level, fill = level), draw_lines = c(0.95, 0.5))

g <- scales::seq_gradient_pal("#e5f5f9", "#2ca25f")
p + scale_fill_manual(values = g(seq(0, 1, length = n))) + theme_bw()