ggcolonviz
A 'ggplot2' Extension for Visualizing the Colon
Provides a 'ggplot2' extension for creating clear, customizable visualizations of the colon. Includes geometry and label layers for plotting colon anatomy and overlaying related data, along with helpers for converting colon segments to 'sf' polygons and generating heatmap grids across the colon geometry.
ggcolonviz
The goal of ggcolonviz is to provide a ggplot2 extension for visualizing the colon in a clear and informative way. It offers a set of functions to create detailed and customizable plots of the colon, allowing users to easily represent various aspects of colon anatomy and related data.
Installation
# install.packages("remotes")
remotes::install_github("Sanofi-Public/ggcolonviz")
Example
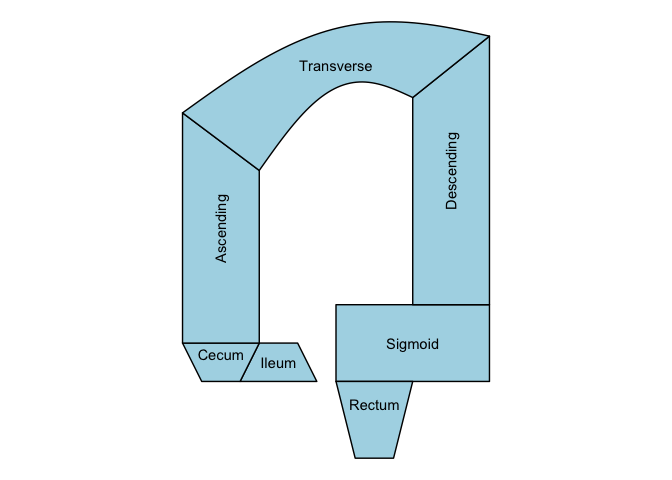
Here is a basic example of how to use ggcolonviz to create a simple plot of the colon:
library(ggcolonviz)
library(ggplot2)

patient_data <- data.frame(
  x = 0,
  y = 0,
  part = c(
    "Ileum",
    "Cecum",
    "Sigmoid",
    "Ascending",
    "Descending",
    "Transverse",
    "Rectum"
  )
)

patient_data |>
  ggplot(aes(x = x, y = y, part = part)) +
  geom_colon(
    color = "black",
    linewidth = 0.5,
    fill = "lightblue"
  ) +
  geom_colon_label() +
  coord_fixed() +
  theme_void()
Contributing
Contributions are welcome! Please feel free to submit a pull request or open an issue if you have any suggestions or find any bugs.
Third-Party Licenses
This package imports {sf}, which
is dual-licensed under GPL-2 and MIT. ggcolonviz uses {sf} under the
MIT branch of that dual license.