fftab
Tidy Manipulation of Fourier Transformed Data
The 'fftab' package stores Fourier coefficients in a tibble and allows their manipulation in various ways. Functions are available for converting between complex, rectangular ('re', 'im'), and polar ('mod', 'arg') representations, as well as for extracting components as vectors or matrices. Inputs can include vectors, time series, and arrays of arbitrary dimensions, which are restored to their original form when inverting the transform. Since 'fftab' stores Fourier frequencies as columns in the tibble, many standard operations on spectral data can be easily performed using tidy packages like 'dplyr'.
fftab 


The goal of fftab is to make working with fft’s in R easier and more
consistent. It follows the tidy philosophy
by working with tabular data rather than lists, vectors, and so on.
Typical signal processing operations can thus often be accomplished in a
single dplyr::mutate call or by a call to similar functions. Some
examples are shown
here.
Installation
You can install the development version of fftab from GitHub with:
# install.packages("pak")
pak::pak("thk686/fftab")
Example
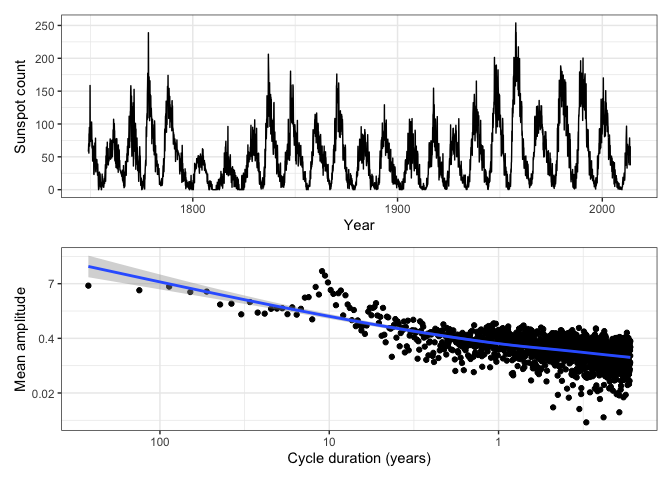
Using fftab with ggplot.
fftab(sunspot.month, norm = TRUE) |>
  to_rect(.keep = "all") |>
  to_polr(.keep = "all") |>
  print(n = 5) ->
ssm.fft
#> # A tibble: 3,177 × 6
#>    .dim_1 fx              re     im   mod    arg
#>     <dbl> <cpl>        <dbl>  <dbl> <dbl>  <dbl>
#> 1 0       51.96+0.00i 52.0    0     52.0   0
#> 2 0.00378  4.37+4.99i  4.37   4.99   6.63  0.852
#> 3 0.00755 -0.86+5.08i -0.860  5.08   5.15  1.74
#> 4 0.0113  -2.65-5.70i -2.65  -5.70   6.29 -2.01
#> 5 0.0151  -4.64-0.59i -4.64  -0.586  4.68 -3.02
#> # ℹ 3,172 more rows
ggplot(fortify(sunspot.month)) +
  geom_line(aes(x = Index, y = Data)) +
  ylab("Sunspot count") +
  xlab("Year") +
  theme_bw() ->
p1

xlocs <- c(1, 0.1, 0.01)
xlabs <- c("1", "10", "100")

ssm.fft |>
  dplyr::filter(.dim_1 > 0) |>
  ggplot() +
  geom_point(aes(x = .dim_1, y = mod)) +
  geom_smooth(aes(x = .dim_1, y = mod)) +
  scale_y_continuous(trans = "log", labels = function(y) signif(y, 1)) +
  scale_x_continuous(trans = "log", breaks = xlocs, labels = xlabs) +
  xlab("Cycle duration (years)") +
  ylab("Mean amplitude") +
  theme_bw() ->
p2

print(p1 / p2)