donutsk
Construct Advanced Donut Charts
Build donut/pie charts with 'ggplot2' layer by layer, exploiting the advantages of polar symmetry. Leverage layouts to distribute labels effectively. Connect labels to donut segments using pins. Streamline annotation and highlighting.
donutsk 


The Donutsk package allows you to build donut/pie charts with ggplot2 layer by layer, exploiting the advantages of polar symmetry. The package is designed to address the limitations of pie charts, which are well-known, while also capitalizing on their ability to effectively represent hierarchical data structures. The following features are worth to be highlighted:
- Create pie or donut charts while retaining ggplot2 flexibility, such as leveraging faceting and palettes, and fine-tuning appearance
- The layout functions help to streamline displaying text and labels geoms without overlapping effectively leveraging space available for pie and donut charts
- The
packing()function arranges data to distribute small values further apart from each other - The set of annotation functions utilizes layout functions to effectively distribute labels within the available space
- The label functions supports
glue::glue()for convenient label construction likeTotal: {.sum}, where.sumis pre-calculated variable.
Installation
You can install the development version of donutsk from GitHub with:
# install.packages("devtools")
devtools::install_github("dkibalnikov/donutsk")
CRAN installation:
install.packages("donutsk")
Example
Basic example:
library(donutsk)
#> Loading required package: ggplot2

# Create an example data set
n <- 40
set.seed(2021)
df <- dplyr::tibble(
 lvl1 = sample(LETTERS[1:5], n, TRUE),
 lvl2 = sample(LETTERS[6:24], n, TRUE),
 value = sample(1:20, n, TRUE),
 highlight_ext = sample(c(FALSE,TRUE), n, TRUE, c(.9, .1))) |>
 dplyr::mutate(highlight_int = dplyr::if_else(lvl1 == "A",TRUE,FALSE))

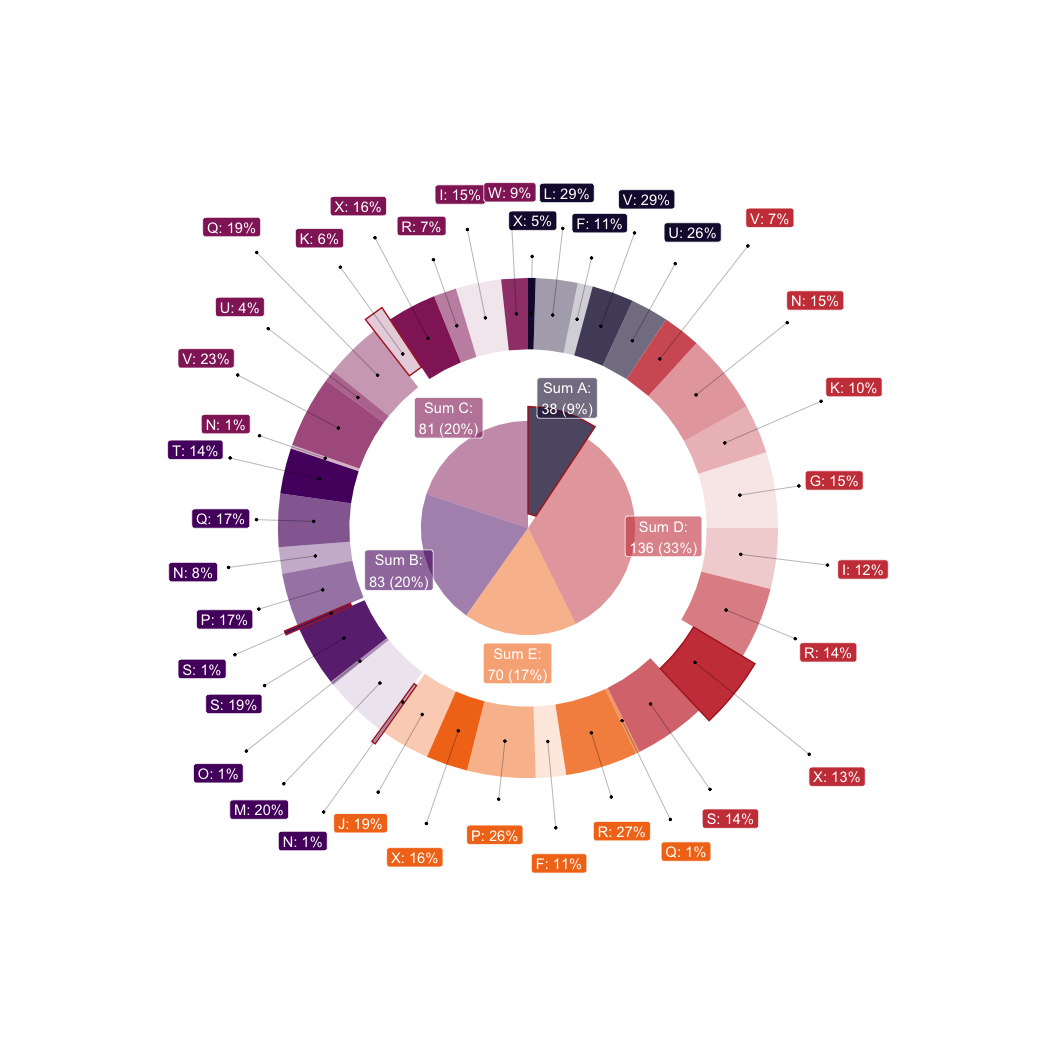
# Doubled donut with advanced labeling
dplyr::group_by(df, lvl1, lvl2, highlight_ext, highlight_int) |>
  dplyr::summarise(value = sum(value), .groups = "drop") |>
  # Pack values effectively
  packing(value, lvl1) |>
  ggplot(aes(value = value, fill = lvl1)) +
  # The donutsk visualization functions
  geom_donut_int(aes(highlight = highlight_int), alpha=.5, r_int = .25) +
  geom_label_int(aes(label = "Sum {fill}:\n{.sum} ({scales::percent(.prc)})"),
                 alpha = .6, col = "white", r=1.2) +
  geom_donut_ext(aes(opacity = lvl2, highlight = highlight_ext)) +
  geom_label_ext(aes(label = paste0(lvl2, ": {scales::percent(.prc_grp)}")),
                 show.legend = FALSE, col="white",
                 layout = tv(thinner = TRUE)) +
  geom_pin(size=.5, linewidth=.1, show.legend = FALSE, cut = .25,
           layout = tv(thinner = TRUE)) +
  # Additional appearance settings
  scale_fill_viridis_d(option = "inferno", begin = .1, end = .7) +
  theme_void() +
  theme(legend.position = "none")  +
  coord_polar(theta = "y")
Alternatives
There is a list of packages that can be considered as alternatives:
- sunburstR: Easily create interactive d3.js sequence sunburst charts in R, originally modeled on an example from Kerry Rodden. Additionally, sunburstR provides another version using d2b from Kevin Warne.
- tastypie: Build pie charts with nice templates.
- webr: Check the
PieDonut()function. - ggpubr: The ‘ggpubr’ package
provides easy-to-use functions for creating and customizing
‘ggplot2’-based publication-ready plots. Check
ggpubr::ggpie()for details.
Considerations
The following list of ideas is considered as a kind of roadmap:
- Integrate round annotations with geomtextpath under the hood.
- Expand the list of layouts with more sophisticated algorithms
- Integrate pattern aesthetics with ggpattern
- Calculate the precise square value for highlighted segments to adjust size