datagrade
Data Quality Assessment on the ISO/IEC 25012 Model
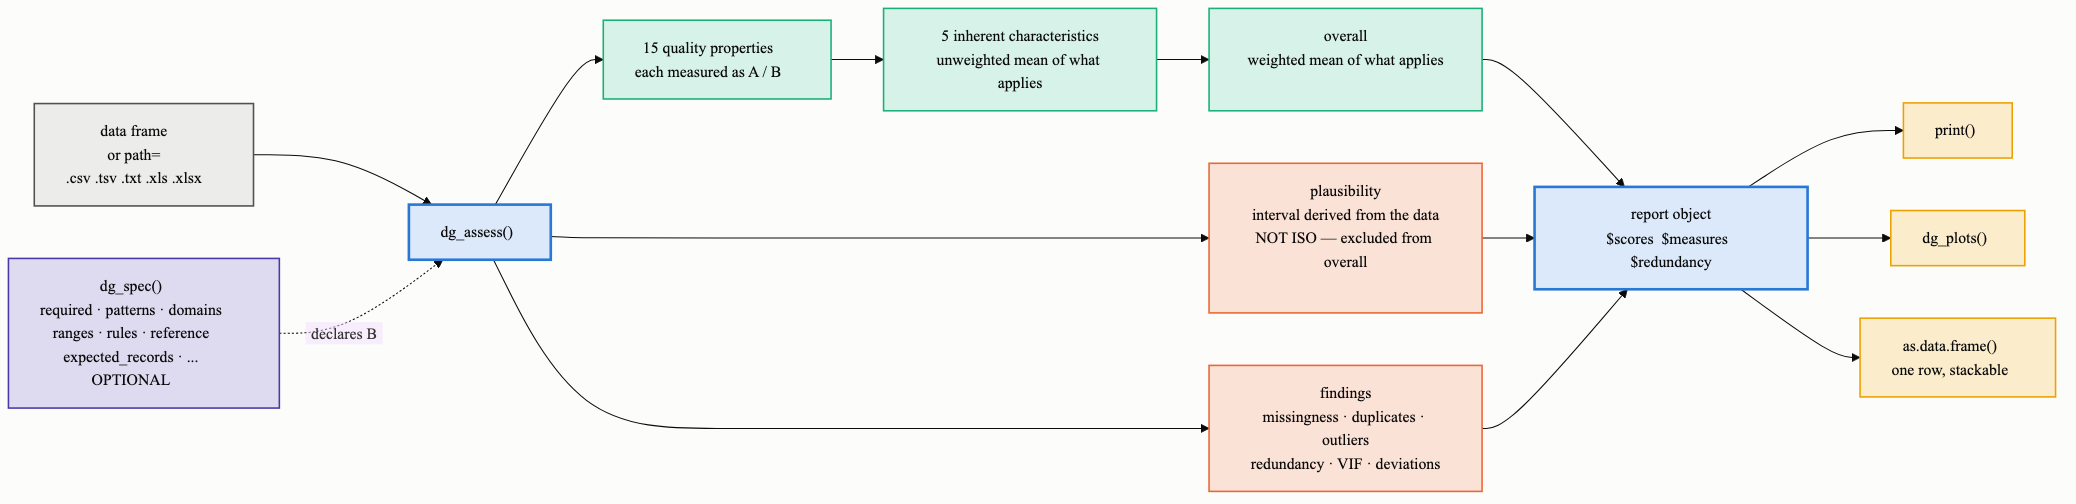
A single-call data quality assessment scoring a data set on the five inherent characteristics of the ISO/IEC 25012 data quality model (accuracy, completeness, consistency, credibility and currentness) through the fifteen quality properties beneath them, ISO/IEC (2008) < https://www.iso.org/standard/35736.html>. Each property is measured as a ratio of counted data items, the form ISO/IEC 25024 measurement functions take, ISO/IEC (2015) < https://www.iso.org/standard/35749.html>. Six properties are computable from a table alone; the rest compare the data against expectations declared through a specification object, and are reported as not applicable rather than approximated when none is supplied. Also reports missing-data patterns, duplicates, redundant columns, outliers, multicollinearity and distributional deviations, and returns a structured object with plots rather than console text alone. The statistics implement the methodology of the author's master's dissertation, Demirhan (2024) "Assessing Data Quality Management Issues in Open-Sourced Data Sets with Statistical Methodology" < https://halukdemirhan.com/assets/msc-thesis-haluk-demirhan-public.pdf>.
datagrade






Point it at a data frame. Get a score.
datagrade assesses the quality of a tabular data set against the ISO/IEC
25012 data quality model — five inherent characteristics, fifteen quality
properties — and returns a report object with tables and figures.
Six of the fifteen properties are computable from a table alone, so it runs on
anything with columns. That is the point. The existing R packages for data
quality (DQA, DQAstats, dataquieR) all require a metadata repository or
data dictionary before they will run at all.
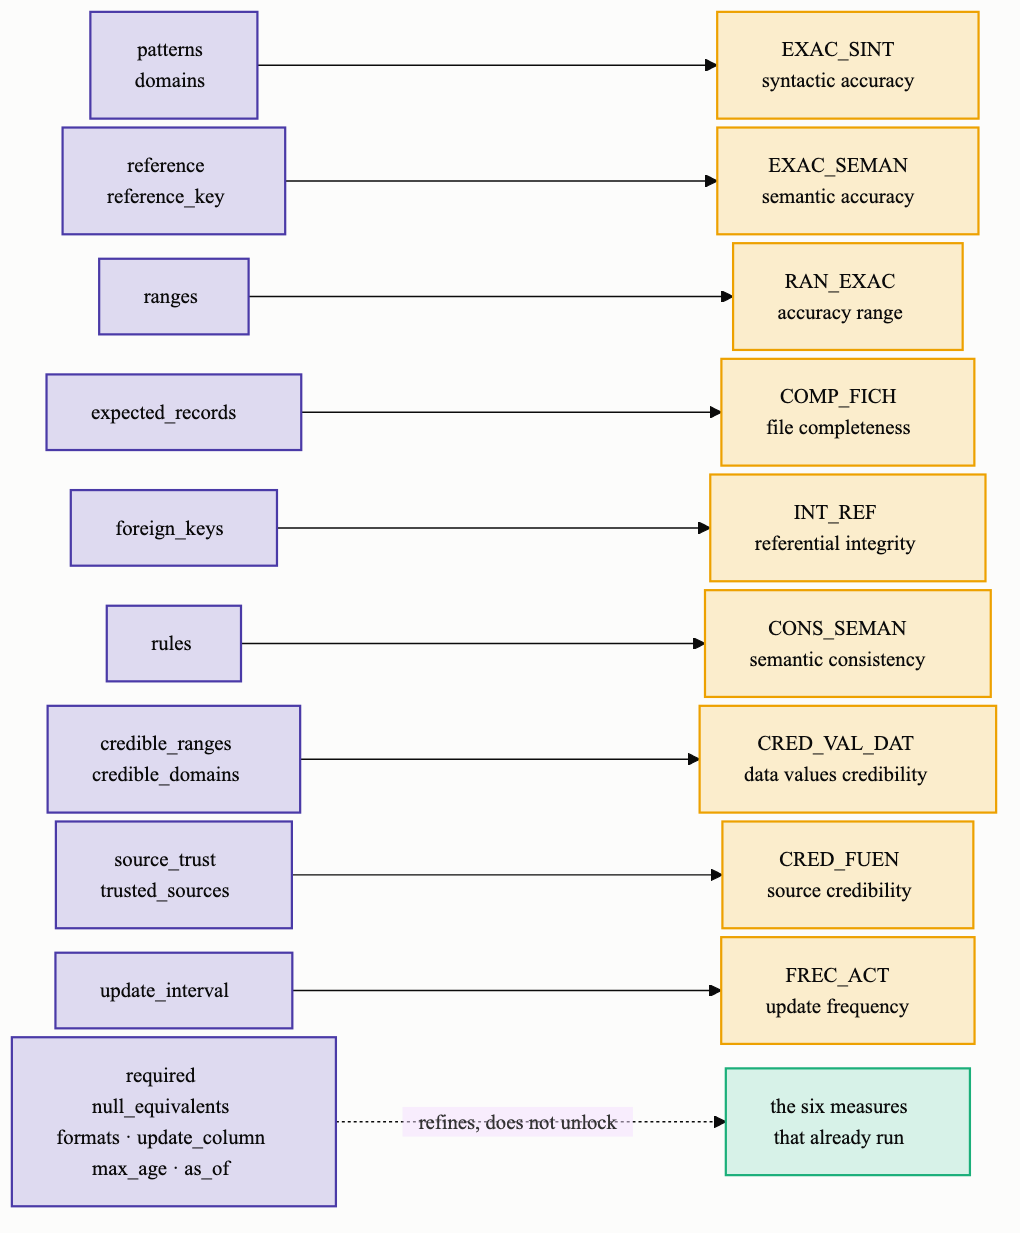
The other nine measure the data against an expectation, and an expectation is
something a person declares — so dg_spec() is where you declare it. Supply
one and those measures light up. Supply nothing and they report as not
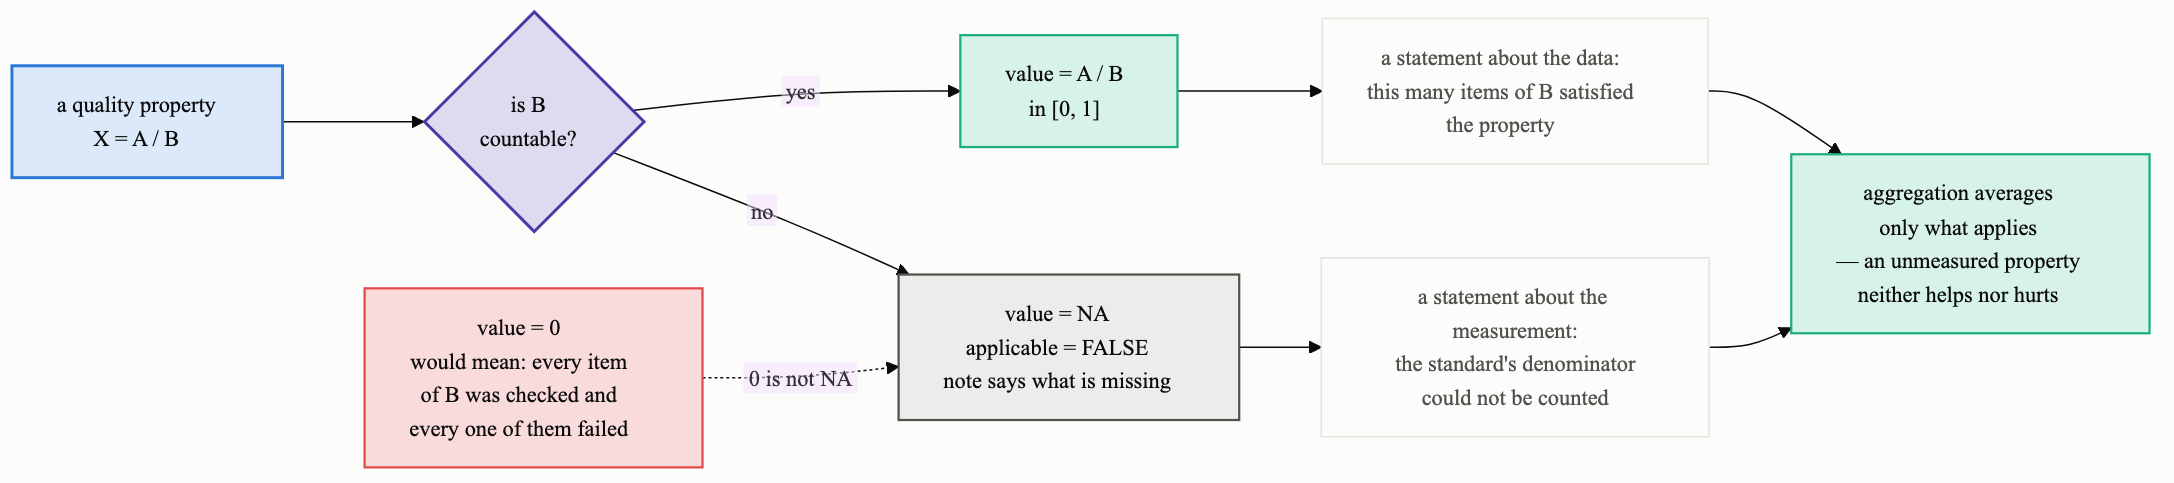
applicable, never as zero: a score of zero is a claim about the data, NA is
a statement that the standard's denominator could not be counted.
Install
# install.packages("remotes")
remotes::install_github("ohalukdemirhan/datagrade")
Use
library(datagrade)

report <- dg_assess(ggplot2::diamonds)
── Data quality report ─────────────────────────────────────────────────
Source: in-memory data frame
Size: 53940 rows x 10 columns
Elapsed: 0.15s

── ISO/IEC 25012 characteristics ──

• accuracy: not applicable (0/3 measures)
• completeness: 1.000 (100%) - good (3/4 measures)
• consistency: 0.600 (60%) - serious (2/4 measures)
• credibility: not applicable (0/2 measures)
• currentness: not applicable (0/2 measures)

Overall: 0.800 (80%) - warning

Not ISO: plausibility 0.993 (99.3%) - outliers against a derived interval,
excluded from the overall score.

ℹ 10 of 15 measures need a declared expectation. See `report$measures` and `dg_spec()`.

── Findings ──

• Missing values: 0 across 0 columns
• Duplicate rows: 146 (0.27%)
• Outliers (z_score): 2798 of 377580 numeric values
• No identifier column detected
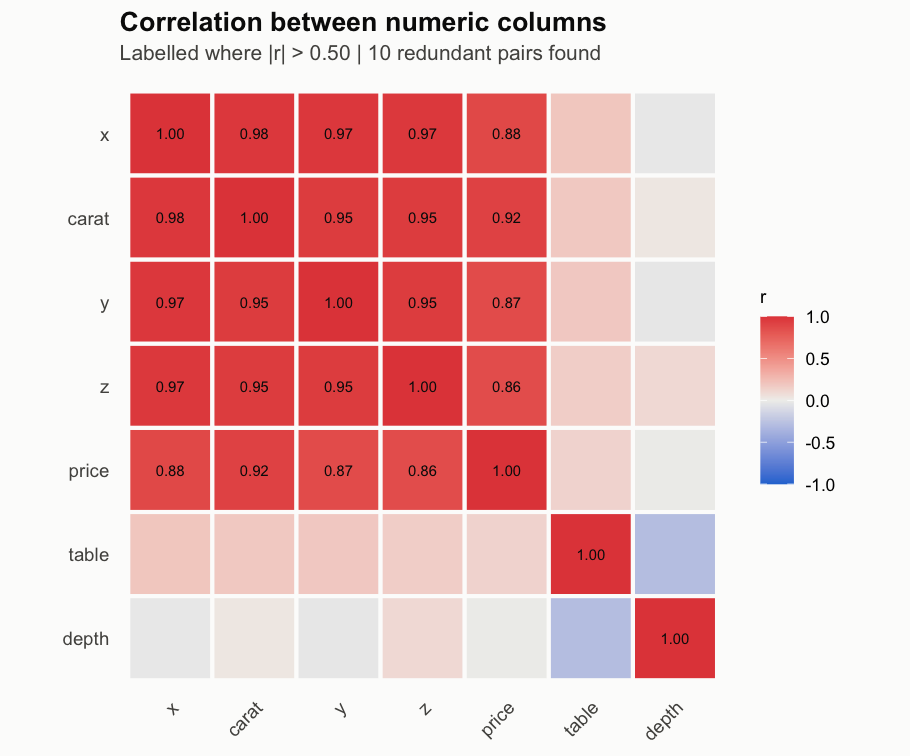
• Redundant pairs above |r| > 0.5: 10 (strongest carat~x at 0.98)
• Suggested to drop: carat, price, x, and y
• VIF above 5: carat, price, x, y, and z
The printout is a side effect. The object is the product:
report$scores            # five characteristics, ratios in [0, 1]
report$measures          # fifteen properties: code, value, A, B, applicable
report$redundancy$pairs  # data frame of correlated column pairs
summary(report)$columns  # per-column type, missingness, outliers, VIF
as.data.frame(report)    # one row, for stacking across many data sets
Declaring what the data should look like
spec <- dg_spec(
  required = c("id", "dept", "amount"),
  patterns = list(id = "^[A-Z]{2}-[0-9]{4}$"),
  domains  = list(dept = c("SALES", "OPS", "HR")),
  ranges   = list(amount = c(0, 1000)),
  rules    = list(order = ~ start <= end)
)

dg_assess(orders, spec = spec)
Every argument is optional, and each one switches on the measures that depend on it:
report$measures says which, and why the rest are still NA:
          code   characteristic value    a    b                                note
     EXAC_SINT         accuracy 1.000  400  400                                <NA>
    EXAC_SEMAN         accuracy    NA   NA   NA  needs spec$reference and reference_key
      RAN_EXAC         accuracy 0.974  187  192                                <NA>
      COMP_REG     completeness 0.960  192  200                                <NA>
  COMP_VAL_ESP     completeness 0.990  792  800                                <NA>
     COMP_FICH     completeness    NA   NA   NA          needs spec$expected_records
 FAL_COMP_FICH     completeness 1.000  400  400                                <NA>
A is the count of items satisfying the property, B the count of items for
which the property is defined at all. That second number is where the metadata
lives, and it is the whole reason nine measures need a spec — and the whole
reason an unmeasurable property reports NA rather than zero:
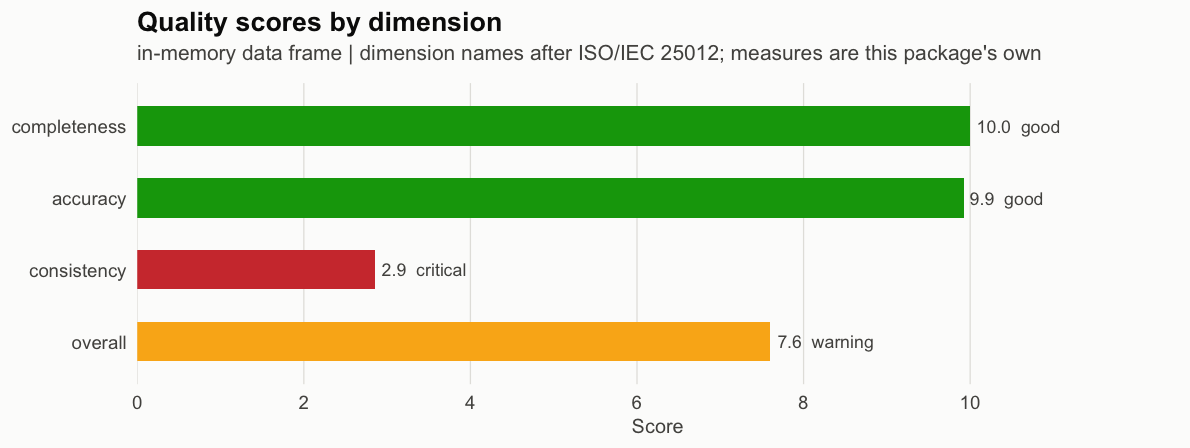
Figures come from dg_plots(report):
Also works on files — dg_assess(path = "data.csv") — for .csv, .tsv,
.txt, .xls and .xlsx.
It scales
Benchmarked on ggplot2::diamonds (53,940 × 10, MIT licensed), then the same
real data replicated with jitter. R 4.5.2, macOS arm64, single core.
| Rows | Input size | Full assessment | Figures | Report object |
|---|---|---|---|---|
| 53,940 | 3.5 MB | 0.12 s | 0.11 s | 82 KB |
| 500,000 | 34 MB | 1.40 s | 0.10 s | 84 KB |
| 1,000,000 | 68 MB | 2.99 s | 0.10 s | 83 KB |
| 5,000,000 | 340 MB | 17.08 s | 0.11 s | 83 KB |
| 10,000,000 | 680 MB | 38.04 s | 0.12 s | 83 KB |
Cost per row is 1.37 µs at 54 thousand rows and 0.94 µs at 10 million — it goes down, because fixed startup amortises. The input grows 185-fold; the report object grows 1%, because it holds statistics and never the data. Figures render in constant time at every size. Scores are identical at every size, which is how you know the subsampling isn't biasing anything.
Reproduce it yourself: Rscript inst/bench/benchmark.R.
Three dependencies: cli, ggplot2, base R.
Documentation
Everything technical lives in the vignettes, not here.
vignette("datagrade")— the full walkthroughvignette("methodology")— every formula, written outvignette("scalability")— how the numbers above are achievedvignette("deviations")— how this differs from the dissertation it implements
The diagrams above are generated, not drawn. Their sources are in
inst/diagrams/*.mmd and regenerate with
mmdc -i inst/diagrams/iso-model.mmd -o man/figures/iso-model.png -b '#fcfcfb' -s 1.5 -w 1600
They use the same palette as the figures, dg_palette in R/palette.R, so a
diagram and a plot in the same README are the same colour system.
Background
This implements the framework from:
Demirhan, O. H. (2024). Assessing Data Quality Management Issues in Open-Sourced Data Sets with Statistical Methodology. MSc dissertation, University of Greenwich.
The dissertation scored four dimensions with measures of its own devising. This
release keeps its statistics but restructures the scoring to follow the ISO/IEC
25012 model, so numbers here will not always match numbers in the dissertation.
vignette("deviations") lists every difference and the reason for it.
The fifteen properties
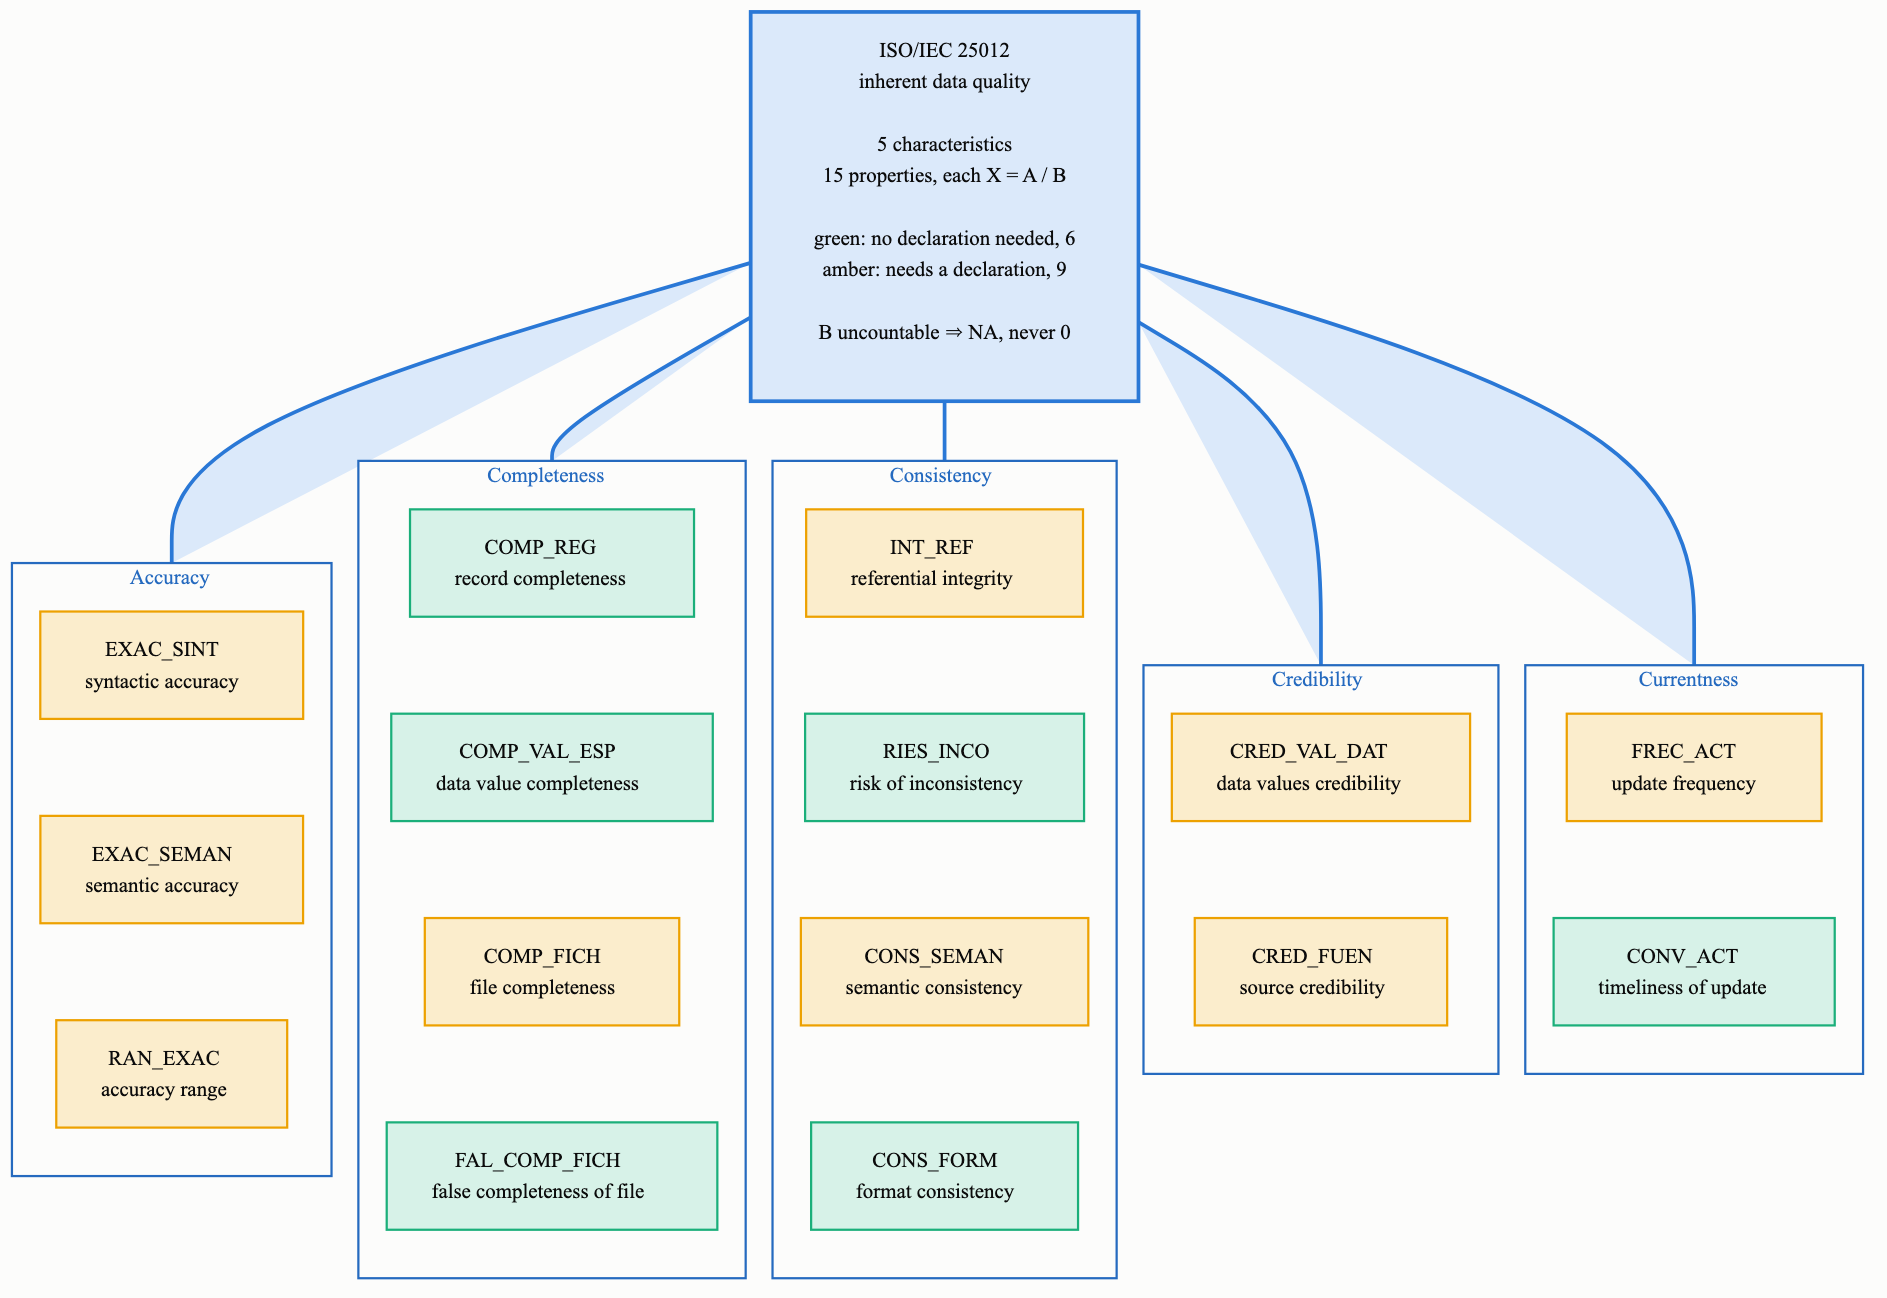
| Characteristic | Property | Code | Needs a spec |
|---|---|---|---|
| Accuracy | Syntactic accuracy | EXAC_SINT |
patterns or domains |
| Semantic accuracy | EXAC_SEMAN |
reference, reference_key |
|
| Accuracy range | RAN_EXAC |
ranges |
|
| Completeness | Record completeness | COMP_REG |
no |
| Data value completeness | COMP_VAL_ESP |
no | |
| File completeness | COMP_FICH |
expected_records |
|
| False completeness of file | FAL_COMP_FICH |
no | |
| Consistency | Referential integrity | INT_REF |
foreign_keys |
| Risk of inconsistency | RIES_INCO |
no | |
| Semantic consistency | CONS_SEMAN |
rules |
|
| Format consistency | CONS_FORM |
no | |
| Credibility | Data values credibility | CRED_VAL_DAT |
credible_ranges/credible_domains |
| Source credibility | CRED_FUEN |
source_trust, trusted_sources |
|
| Currentness | Update frequency | FREC_ACT |
update_interval |
| Timeliness of update | CONV_ACT |
no |
Two of the six zero-configuration measures deserve a note, because both infer their expectation from the column itself rather than from a declaration:
FAL_COMP_FICHcompares text values against a short, deliberately conservative list of placeholders —"N/A","unknown","-999"and a dozen more, matched case-insensitively after trimming. Passnull_equivalentsto replace the list, orcharacter(0)to switch the check off.CONS_FORMreduces each value to a shape — digit runs become9, letter runsA— and measures how many share their column's dominant shape. A column whose values collapse to many shapes has no format to be consistent with, so free text is excluded from the denominator and named in the measure'snoterather than scored near zero.
What is not claimed
plausibility is reported alongside the five characteristics and excluded from
the overall score. It is the dissertation's accuracy measure: outliers against
an interval derived from the data (μ ± 3σ, or the IQR fence). Every ISO
accuracy property requires an interval, pattern or reference that was
declared, so substituting a statistically derived one measures plausibility,
not accuracy — an outlier need not be wrong, and a wrong value can sit exactly
on the mean. It is kept because it is genuinely useful on undocumented data, and
named honestly because it is not the standard's measure.
Aggregation from properties to characteristics is the unweighted mean over the
properties that apply; from characteristics to overall it is the weighted mean
over the characteristics that apply. ISO/IEC 25024 does not specify how
measures aggregate, so both steps are this package's choice, not the
standard's.
References
The ISO claims above are sourced. The standards themselves are paywalled. The
model's structure — the five inherent characteristics, the fifteen properties
beneath them and their identifiers — is taken from the peer-reviewed literature
cited below. The standard's own measurement functions are not reproduced:
each measure here is this package's implementation of the named property, in
the A / B form the standard uses, with its A and B stated in
report$measures and derived in vignette("methodology").
- ISO/IEC 25024:2015. Systems and software engineering — Systems and software Quality Requirements and Evaluation (SQuaRE) — Measurement of data quality. International Organization for Standardization. https://www.iso.org/standard/35749.html
- ISO/IEC 25012:2008. Software engineering — SQuaRE — Data quality model. International Organization for Standardization. https://www.iso.org/standard/35736.html
- Gualo, F., Rodriguez, M., Verdugo, J., Caballero, I. and Piattini, M. (2021).
'Data Quality Certification using ISO/IEC 25012: Industrial Experiences',
Journal of Systems and Software. https://arxiv.org/abs/2102.11527 —
source for the
X = A/Bmeasurement-function form, for the Accuracy Range (RAN_EXAC) measure whose element B is "the number of data items for which a required interval of values can be defined", and for the statement that ISO/IEC 25024 does not specify how measures aggregate into a per-characteristic score. Written by an ISO/IEC 25012 accredited evaluation laboratory. - Calabrese, J., Esponda, S. and Pesado, P. (2020). 'Framework for Data Quality
Evaluation Based on ISO/IEC 25012 and ISO/IEC 25024', 8th Conference on
Cloud Computing, Big Data & Emerging Topics, Universidad Nacional de La
Plata. https://sedici.unlp.edu.ar/handle/10915/104778 — source for the five
inherent characteristics being Accuracy, Completeness, Consistency,
Credibility and Currentness, and for the decomposition of each into the
fifteen quality properties and their identifiers (
EXAC_SINT,COMP_REG,RIES_INCO,CRED_FUEN,CONV_ACTand the rest) implemented here. What remains unverified against the standard itself is the exact definition of each measure's quality measure elements — precisely which items ISO counts intoAandBfor a given property. Those are in Annexes A–E of ISO/IEC 25024, which are not in any public source. Where this package had to choose, the choice is stated invignette("methodology")and visible in theaandbcolumns ofreport$measures, so it can be checked and disagreed with.
Licence
MIT © Omer Haluk Demirhan