cyjShiny
Cytoscape.js Shiny Widget (cyjShiny)
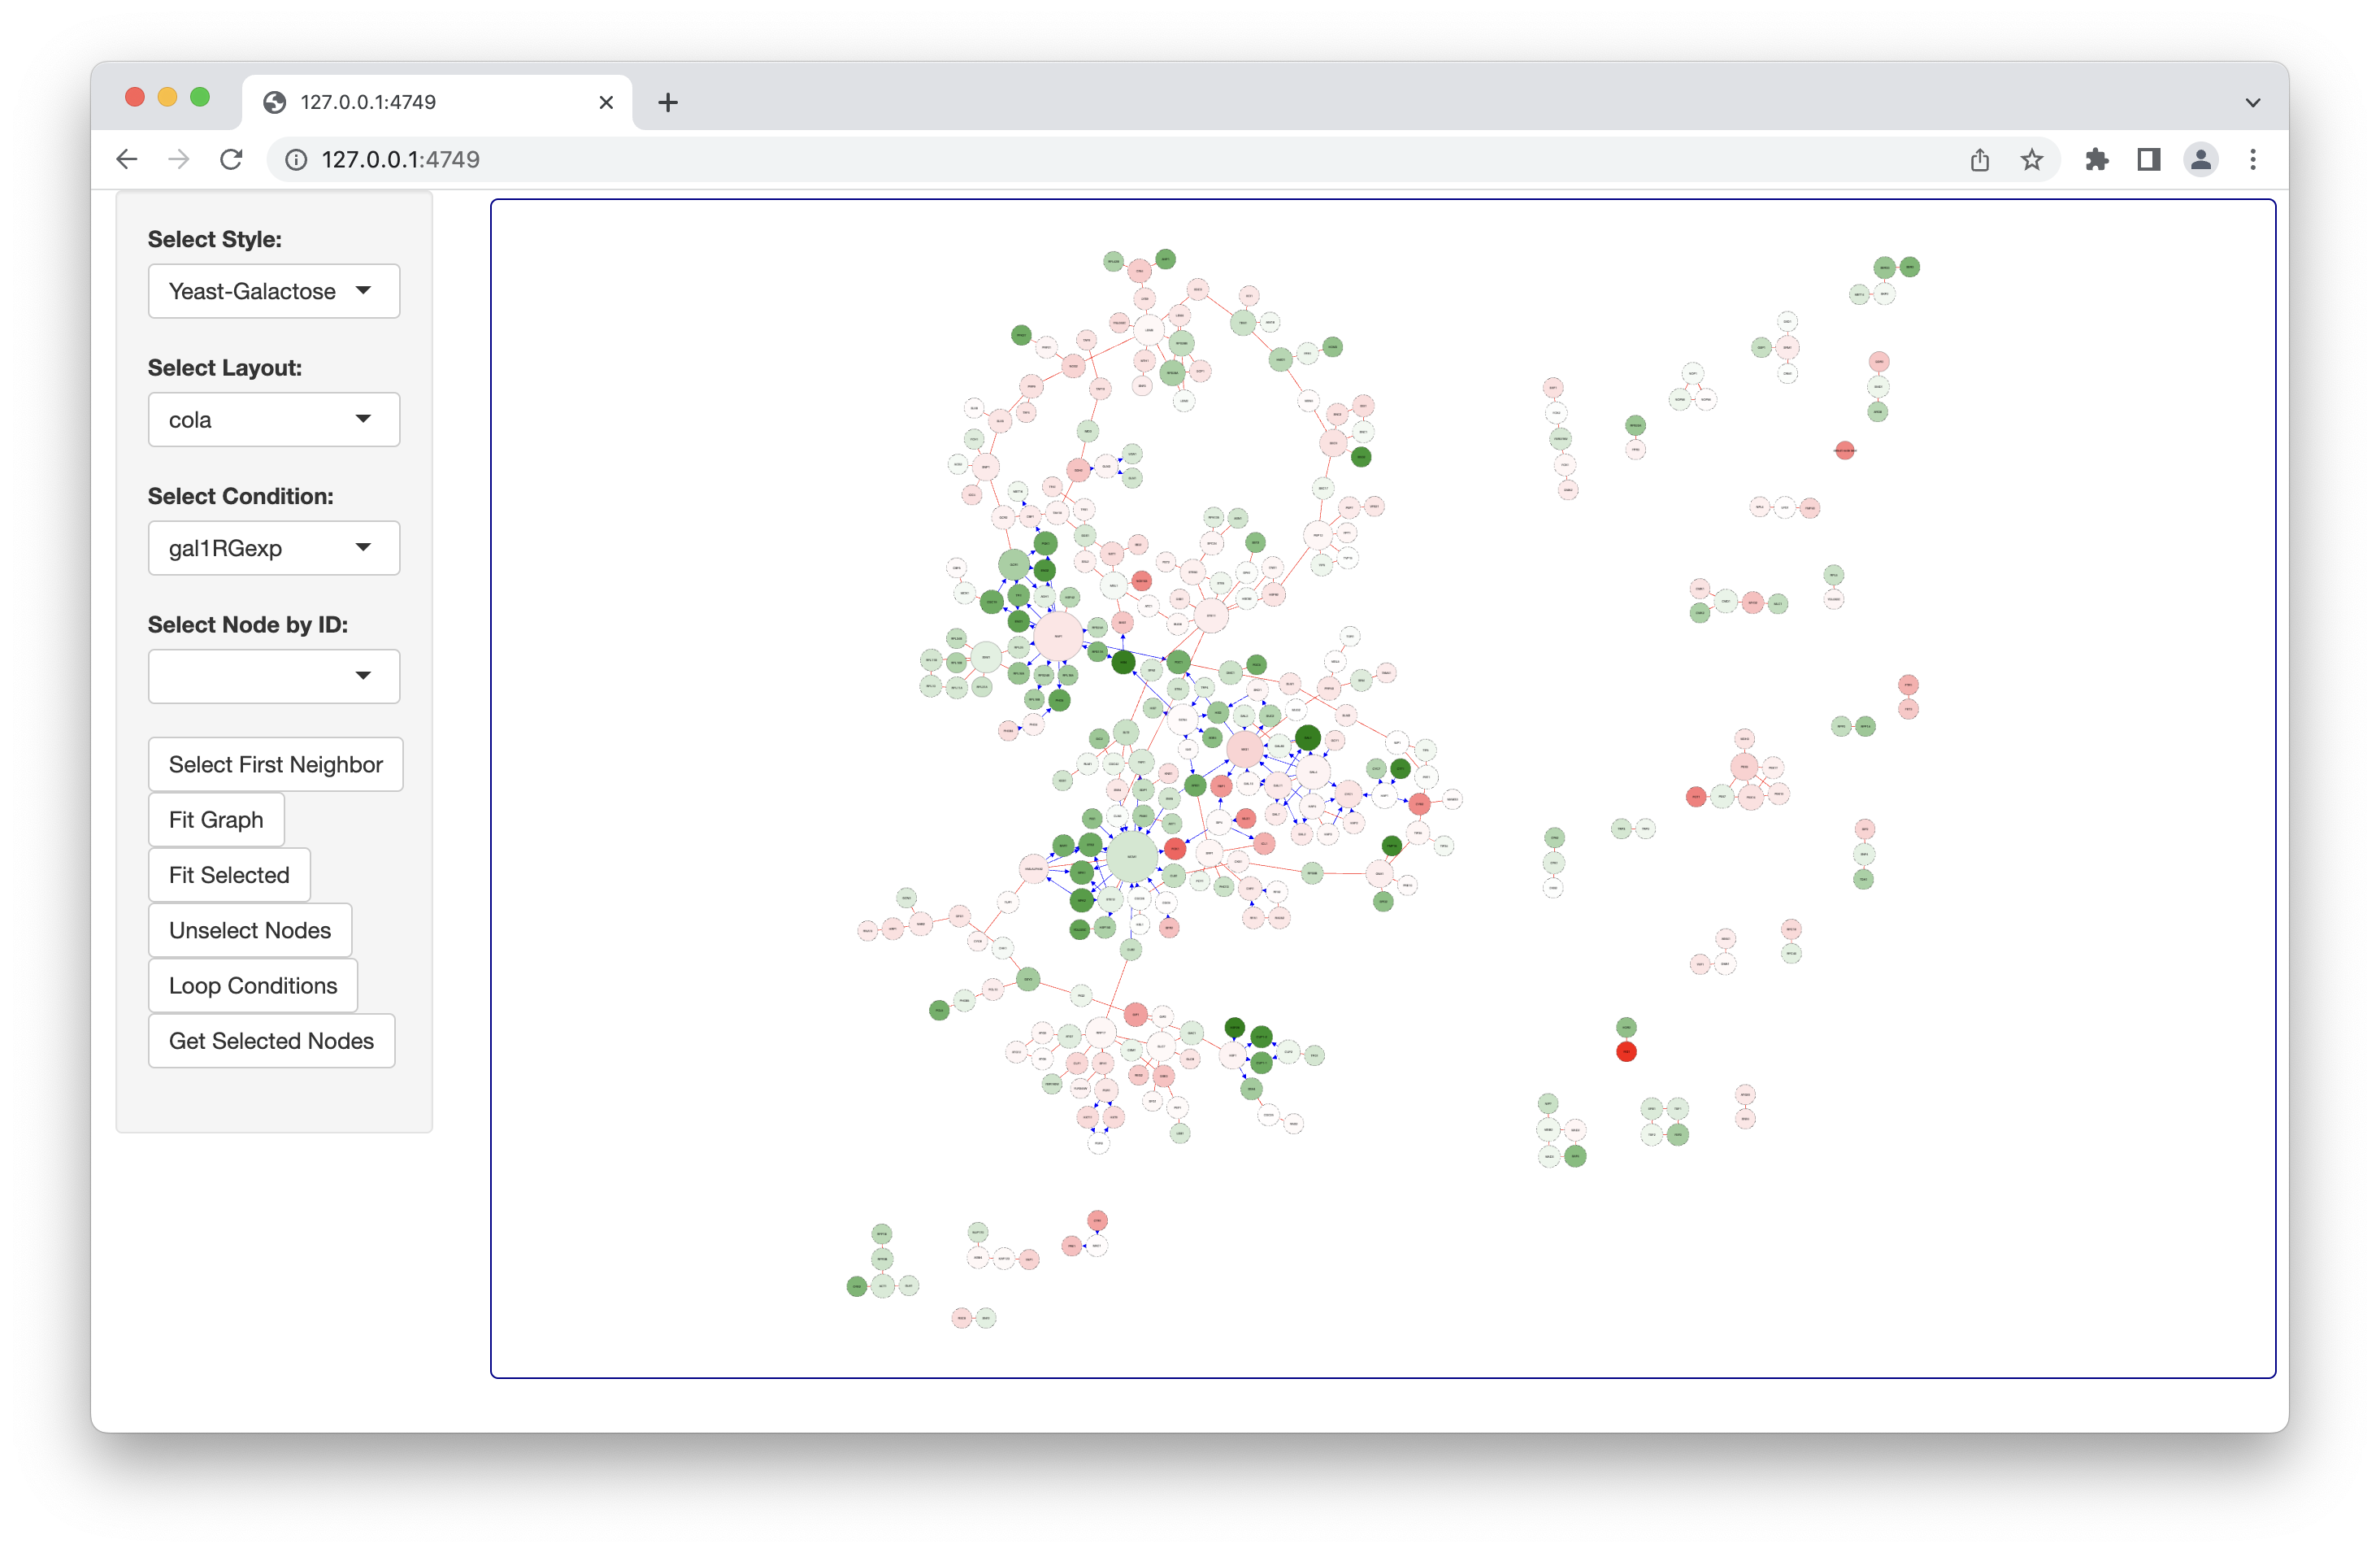
Wraps cytoscape.js as a shiny widget. cytoscape.js < https://js.cytoscape.org/> is a Javascript-based graph theory (network) library for visualization and analysis. This package supports the visualization of networks with custom visual styles and several available layouts. Demo Shiny applications are provided in the package code.

cyjShiny
cyjShiny is a Shiny widget based on htmlWidgets for network visualization using cytoscape.js.
Installation
From CRAN (Stable Version)
Users should start with CRAN as it is the most stable version:
install.packages("cyjShiny")
Install from GitHub (Development Version)
library(remotes)
remotes::install_github(repo="cytoscape/cyjShiny", ref="master", build_vignette=TRUE)
Compile cytoscape.js (Javascript Development)
Instructions for compiling cytoscape.js for use with htmlWidgets. NOTE: This should only be used by those actively modifying cytoscape.js.
Quick Start (First cyjShiny App)
- Shiny Development Basics
- Shiny Extensions for Embedding Javascript Visualizations
- Get Help:
help(package="cyjShiny")- Main available features: layouts, node selection, styling, save to PNG, fit graphs to display area
- Quick Start Example:
library(shiny)
library(cyjShiny)
library(graph)
library(jsonlite)

# NETWORK DATA ----
tbl_nodes <- data.frame(id=c("A", "B", "C"),
                        size=c(10, 20, 30),
                        stringsAsFactors=FALSE)

# Must have the interaction column
tbl_edges <- data.frame(source=c("A", "B", "C"),
                        target=c("B", "C", "A"),
                        interaction=c("inhibit", "stimulate", "inhibit"),
                        stringsAsFactors=FALSE)

graph_json <- toJSON(dataFramesToJSON(tbl_edges, tbl_nodes), auto_unbox=TRUE)

# UI ----
ui <- fluidPage(cyjShinyOutput('cyjShiny'))

# SERVER ----
server <- function(input, output, session) {
  output$cyjShiny <- renderCyjShiny({
    # Layouts (see js.cytoscape.org): cola, cose, circle, concentric, grid, breadthfirst, random, fcose, spread
    cyjShiny(graph_json, layoutName="cola")
  })
}

# RUN ----
shinyApp(ui=ui, server=server)
Styling
Many of the visual properties of a network can be stylized.
- Styling Documentation
- Example Styling (
data()maps data dynamically to specify a property value from the input data.frame):
[
  {"selector":"node", "css": {
    "border-width": "2px",
    "width": "data(size)",
    "height": "data(size)",
    "content": "data(id)"
  }},
  {"selector": "edge[interaction='stimulate']", "css": {
    "line-color": "green"
  }},
  {"selector": "edge[interaction='inhibit']", "css": {
    "line-color": "red"
  }}
]
- Styling Usage with Quick Start Example:
Save the example styling to a file style.js in the current working directory and replace cyjShiny() in the Quick Start example as shown below:
cyjShiny(graph_json, layoutName="cola", styleFile="style.js")
Demos
- Try basicDemo Demo on shinyapps.io
- basicDemo Code
- Other Demos:
- quickStartDemo: Demo used in README; Code
- rmarkdownDemo: Demo for cyjShiny use in R Markdown files; Code
- dataFrameGraphWithPresetNodePositions: Use preset layout to set node positions; Code
- fromCytoscapeDesktop: Load and visualize networks generated in Cytoscape Desktop; Code
- saveAndRestoreLayout: Within a session, save node positions and restore positions for nodes moved after positions saved; Code
- withDT: Include at DT table of node values along with the graph visualization; Code