T4cluster
Tools for Cluster Analysis
Cluster analysis is one of the most fundamental problems in data science. We provide a variety of algorithms from clustering to the learning on the space of partitions. See Hennig, Meila, and Rocci (2016, ISBN:9781466551886) for general exposition to cluster analysis.
Tools for Cluster Analysis 
T4cluster is an R package designed as a computational toolkit with comprehensive coverage in relevant topics around the study of cluster analysis. It contains several classes of algorithms for
- Clustering with Vector-Valued Data
- Clustering with Functional Data
- Clustering with Empirical Distributions
- Clustering on the Unit Hypersphere
- Subspace Clustering
- Measures : Compare Two Clusterings
- Measures : Quality of a Clustering
- Learning with Multiple Clusterings
and other utility functions for further use. If you request additional functionalities or have suggestions, please contact maintainer.
Installation
You can install the released version of T4cluster from CRAN with:
install.packages("T4cluster")
And the development version from GitHub with:
# install.packages("devtools")
devtools::install_github("kisungyou/T4cluster")
Minimal Example : Clustering SMILEY Data
T4cluster offers a variety of clustering algorithms in common
interface. In this example, we show a basic pipeline with smiley
dataset, which can be generated as follows;
# load the library
library(T4cluster)

# generate the data
smiley = T4cluster::genSMILEY(n=200)
data   = smiley$data
label  = smiley$label

# visualize
plot(data, pch=19, col=label, xlab="", ylab="", main="SMILEY Data")
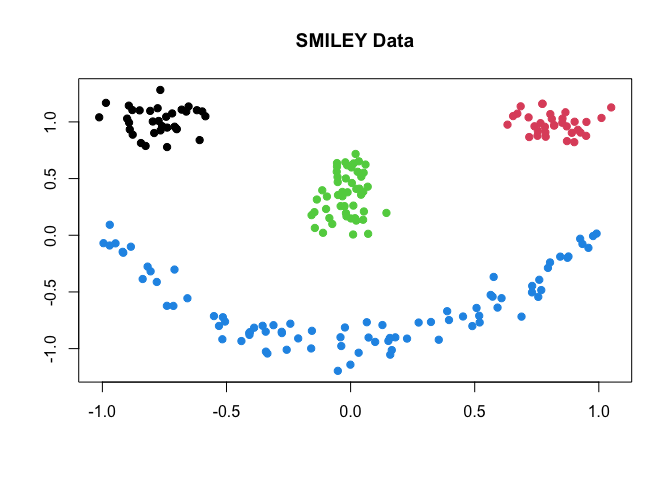
where each component of the face is considered as one cluster - the data
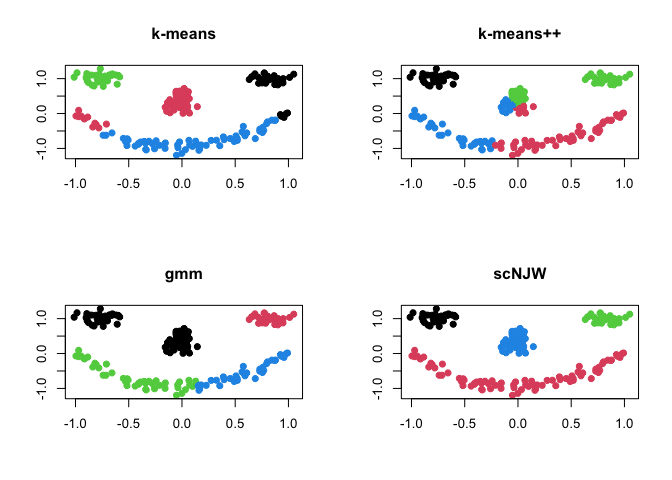
has 4 clusters. Here, we compare 4 different methods; (1) k-means
(kmeans), (2) k-means++ (kmeanspp), (3) gaussian mixture model
(gmm), and (4) spectral clustering with normalized cuts (scNJW).
# run algorithms
run1 = T4cluster::kmeans(data, k=4)
run2 = T4cluster::kmeanspp(data, k=4)
run3 = T4cluster::gmm(data, k=4)
run4 = T4cluster::scNJW(data, k=4, sigma = 0.1)

# visualize
par(mfrow=c(2,2))
plot(data, pch=19, xlab="", ylab="", col=run1$cluster, main="k-means")
plot(data, pch=19, xlab="", ylab="", col=run2$cluster, main="k-means++")
plot(data, pch=19, xlab="", ylab="", col=run3$cluster, main="gmm")
plot(data, pch=19, xlab="", ylab="", col=run4$cluster, main="scNJW")