PNC
Evaluating Phylogeny as a Proxy for Ecological Similarity
Provides a trait-based workflow for evaluating whether phylogenetic relatedness is informative about similarity in measured quantitative traits within focal species pools and across multiple communities. Functions support trait data integration, taxon-specific trait extraction, coverage assessment, optional principal component analysis, and estimation of phylogenetic signal using Pagel's lambda or Blomberg's K. Curated quantitative trait datasets are included for plants, birds, mammals, reptiles, amphibians, and fishes. Paired simulations assess how observed patterns of missing trait data affect Pagel's lambda estimates and significance classifications for individual traits. Methods for quantifying phylogenetic signal are based on Pagel (1999)
PNC 
PNC is an R package for evaluating phylogenetic signal in quantitative traits within a focal species pool or across multiple ecological communities.It combines trait preparation, coverage assessment, optional principal component analysis (PCA), estimation of Pagel's lambda and Blomberg's K, and simulation based assessment of how observed missing trait data affect inference.
Phylogenetic signal is the statistical tendency for related taxa to resemble one another in measured traits. When phylogeny is used as a proxy for ecological similarity, evaluating signal in the relevant traits provides an empirical check on that assumption. Interpretation should remain tied to the measured trait dimensions, focal taxa, and species pool.
Installation
Install the released version from CRAN:
install.packages("PNC")
Install the development version from GitHub:
if (!requireNamespace("remotes", quietly = TRUE)) {
  install.packages("remotes")
}

remotes::install_github("biodiversity-monitoring/PNC")
Workflow
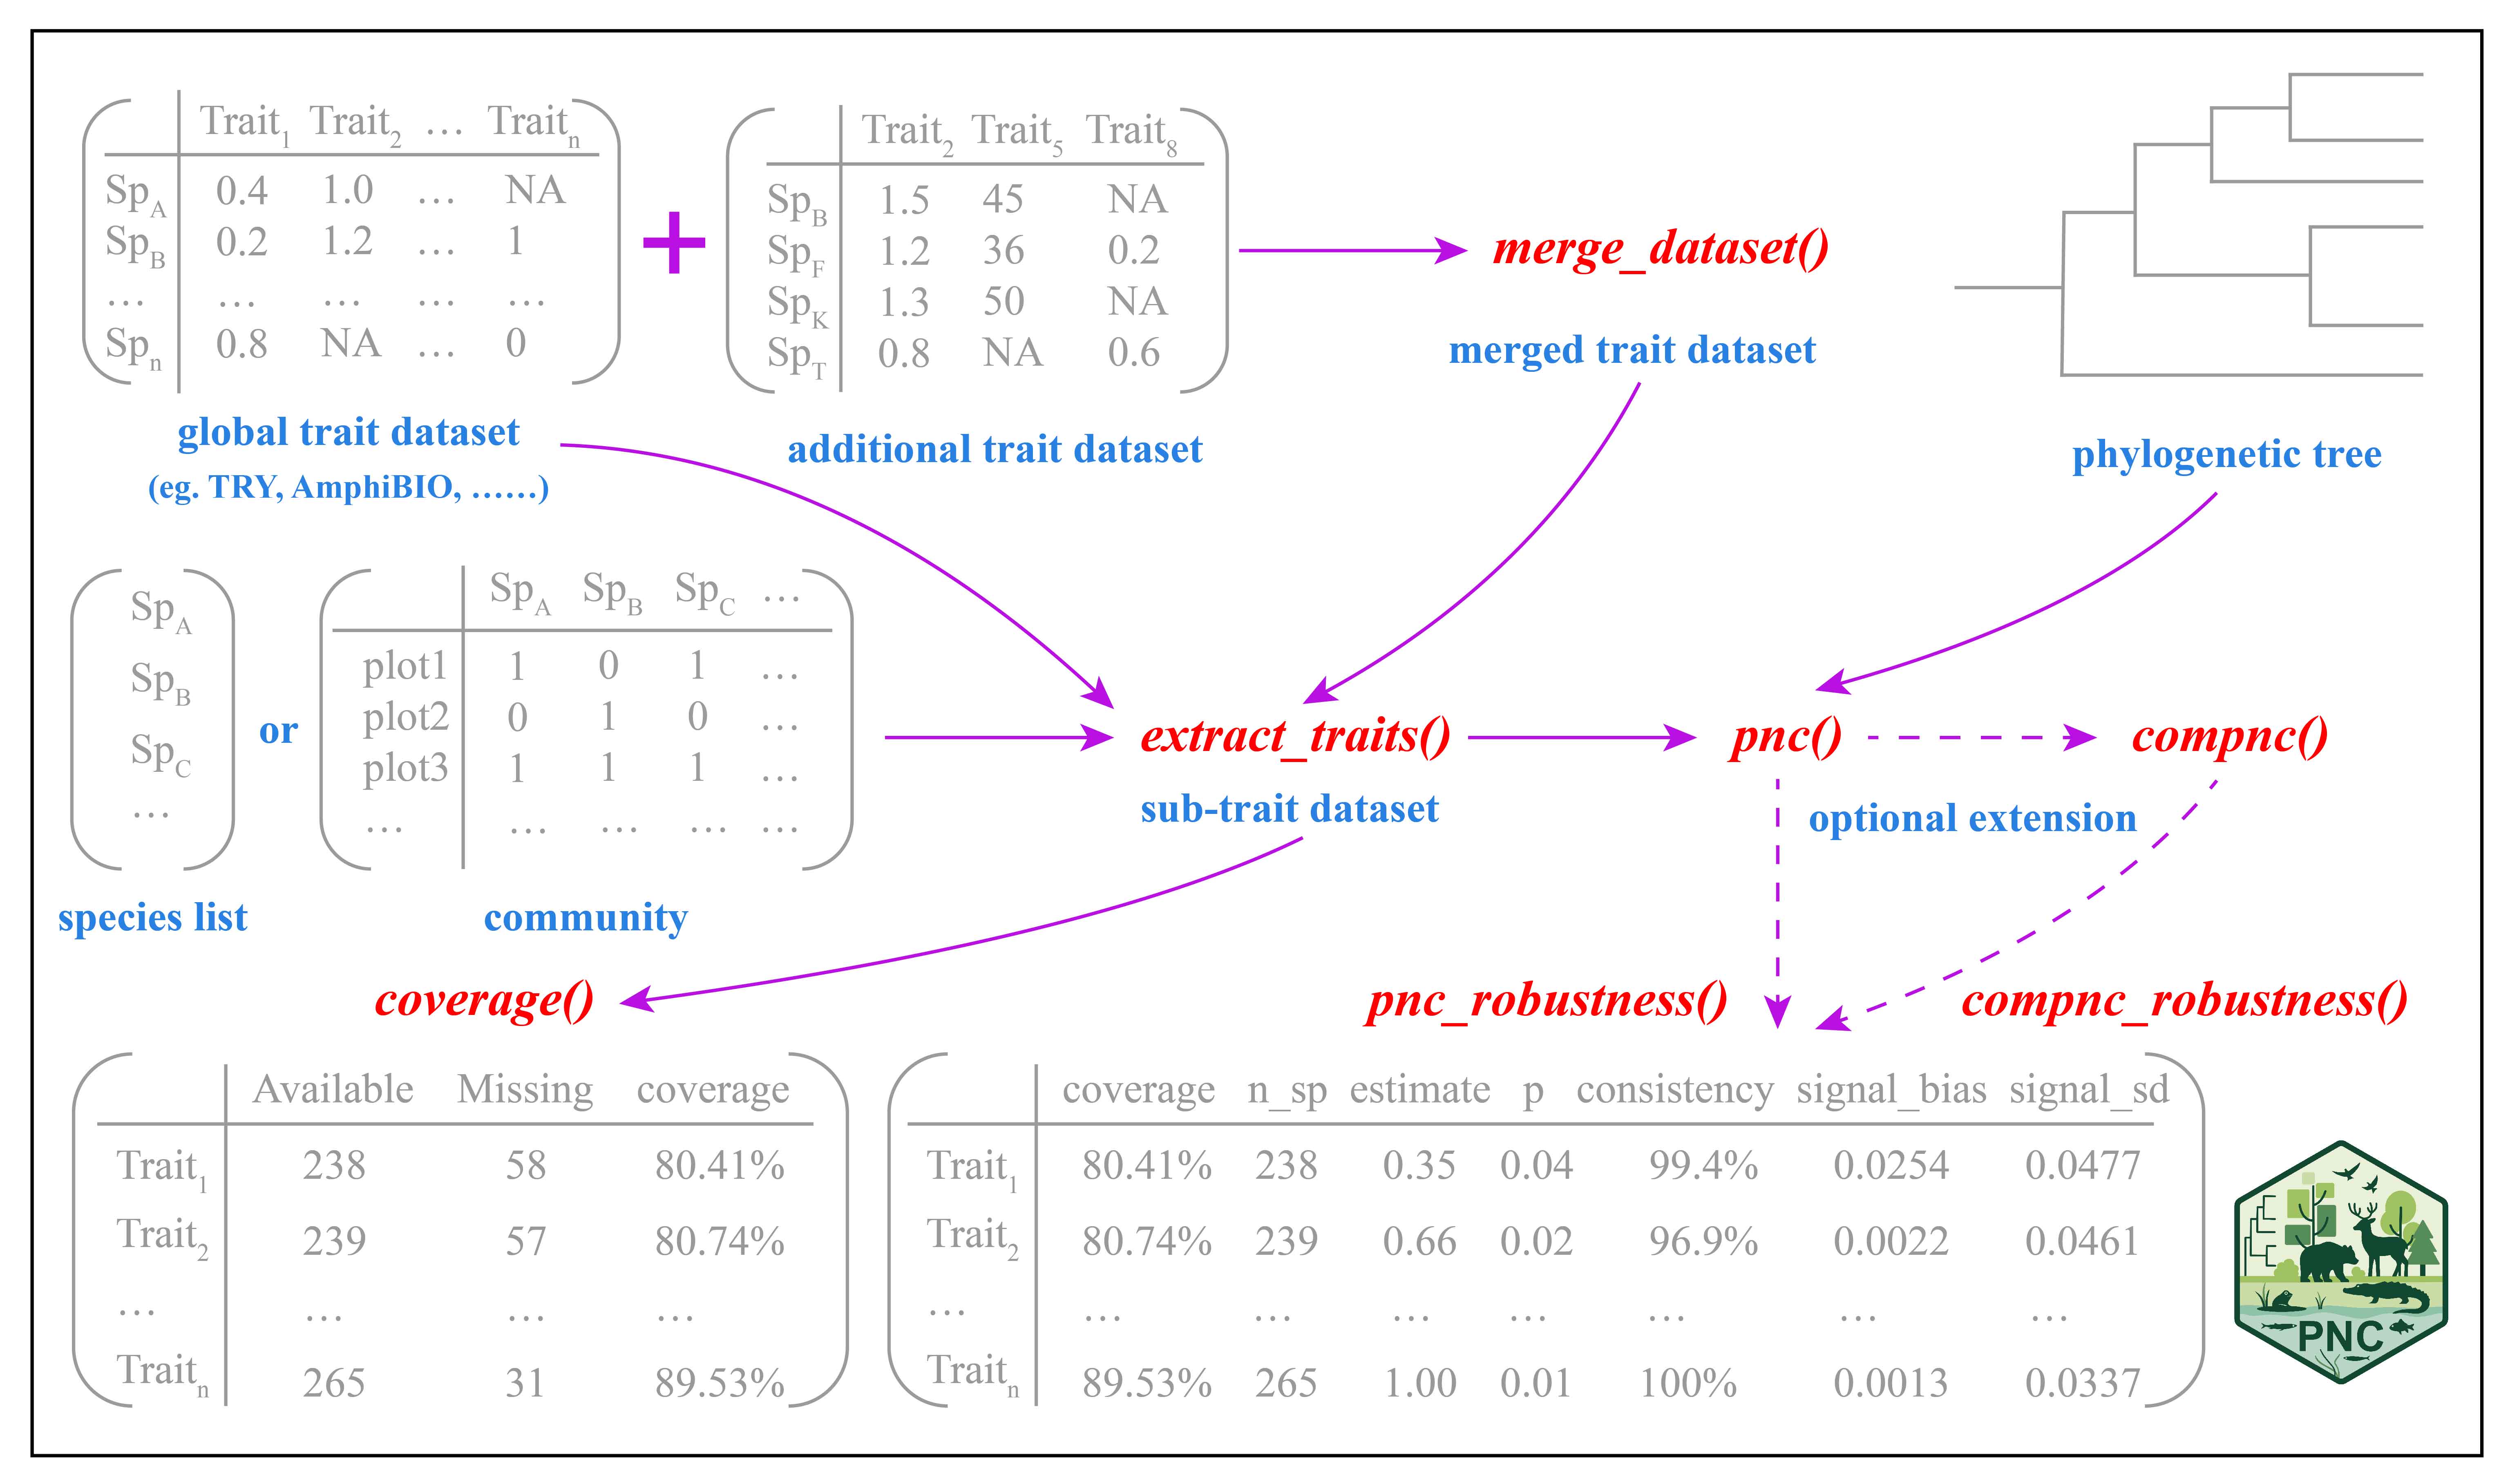
The workflow has three linked stages:
- Prepare quantitative trait data and assess coverage for individual traits and complete cases.
- Estimate phylogenetic signal for individual traits and, optionally, PCA axes within one species pool or across multiple communities.
- Assess how the observed missing data pattern affects inference based on Pagel's lambda for individual traits.
Main functions
| Function | Purpose |
|---|---|
merge_dataset() |
Combines two trait datasets by species and resolves overlapping values according to a user selected priority rule. |
extract_traits() |
Extracts selected numeric traits for species, genera, or families and resolves repeated species records. |
coverage() |
Summarizes coverage for each trait, complete cases across all traits, and the overall dataset. |
pnc() |
Estimates Pagel's lambda, Blomberg's K, or both within a focal species pool, with optional PCA. |
compnc() |
Estimates phylogenetic signal across multiple communities and uses a common PCA space when PCA is requested. |
pnc_robustness() |
Uses paired simulations to assess how the observed missing data pattern affects Pagel's lambda inference within a focal species pool. |
compnc_robustness() |
Extends the paired missing data assessment across multiple communities. |
Included data
PNC includes processed quantitative trait datasets representing six major taxonomic groups.
| Dataset | Taxonomic group | Trait content | Source |
|---|---|---|---|
TRY |
Plants | Leaf, stem, size, root, and reproductive traits | Kattge et al. (2020) |
AVONET |
Birds | Morphological traits including beak, wing, tarsus, tail, and body mass | Tobias et al. (2022) |
COMBINE |
Mammals | Morphology, life history, diet, habitat, and geographical traits | Soria et al. (2021) |
ReptTraits |
Reptiles | Morphological, environmental, thermal, longevity, and reproductive traits | Oskyrko et al. (2024) |
AmphiBIO |
Amphibians | Body size, life history, and reproductive traits | Oliveira et al. (2017) |
FishLife |
Fishes | Morphological, ecological, and life history traits | Thorson et al. (2023) |
Two datasets support the examples below:
| Dataset | Contents | Source |
|---|---|---|
BCI |
Plant species information, species and genus phylogenies, and a community matrix from Barro Colorado Island | Condit et al. (2019) |
HimalayanBirds |
Bird species information, a species phylogeny, and community composition across 12 elevation bands | Ding et al. (2021) |
See the documentation for each dataset for variable definitions, units, and source information.
Quick start: one species pool
The BCI example evaluates phylogenetic signal in six plant traits at the species level.
library(PNC)

data("BCI", package = "PNC")
data("TRY", package = "PNC")

plant_traits <- c(
  "LA",
  "LMA",
  "LeafN",
  "PlantHeight",
  "SeedMass",
  "SSD"
)

bci_species <- colnames(BCI$com)

bci_traits <- extract_traits(
  bci_species,
  TRY,
  rank = "species",
  traits = plant_traits
)

coverage(bci_traits)

bci_signal <- pnc(
  trait_data = bci_traits,
  phylo_tree = BCI$phy_species,
  methods = c("lambda", "K"),
  pca_axes = c("PC1", "PC2")
)

bci_signal
Set pca_axes = NULL to analyze the original traits without PCA. When PCA axes are requested, pnc() uses taxa that are shared between the trait data and phylogeny and have complete values across all supplied traits.
Multiple communities
The Himalayan bird example estimates signal separately within 12 elevation bands.
data("HimalayanBirds", package = "PNC")
data("AVONET", package = "PNC")

bird_species <- colnames(HimalayanBirds$com)

bird_traits <- extract_traits(
  bird_species,
  AVONET,
  rank = "species"
)

coverage(bird_traits)

bird_signal <- compnc(
  com = HimalayanBirds$com,
  trait_data = bird_traits,
  phylo_tree = HimalayanBirds$phy_species,
  methods = "lambda",
  pca_axes = c("PC1", "PC2"),
  min_abundance = 0
)

bird_signal
For PCA, compnc() fits one PCA to the eligible species pooled across communities and then uses the resulting species scores in every community. A given PC axis therefore represents the same dimension of trait variation across communities.
Missing data assessment
pnc_robustness() and compnc_robustness() assess how the observed missing data pattern affects Pagel's lambda inference. For each trait, complete values are simulated under Brownian motion on a reference phylogeny transformed according to the observed lambda. Within each simulation, lambda is estimated once for the complete reference species pool and again after removing the taxa that lack observed values for the focal trait. Because both estimates use the same simulated trait realization, their difference measures the change associated with applying that missing data pattern in that simulation.
set.seed(123)

bci_missing <- pnc_robustness(
  trait_data = bci_traits,
  phylo_tree = BCI$phy_species,
  n_simulations = 1000,
  alpha_level = 0.05
)

bci_missing
For multiple communities:
set.seed(123)

bird_missing <- compnc_robustness(
  com = HimalayanBirds$com,
  trait_data = bird_traits,
  phylo_tree = HimalayanBirds$phy_species,
  min_abundance = 0,
  n_simulations = 1000,
  alpha_level = 0.05
)

bird_missing
The current missing data assessment is applied to individual traits only; PCA axes are not included.
Interpreting the output
Phylogenetic signal
pnc() and compnc() return one row for each trait and method combination.
| Column | Meaning |
|---|---|
trait |
Original trait or requested PCA axis. |
coverage |
Percentage of taxa in the relevant species pool with data available for the analyzed trait or PCA axis. |
n_sp |
Number of taxa actually used after matching trait data with the phylogeny. |
signal |
Estimated Pagel's lambda or Blomberg's K. |
p |
P value associated with the signal estimate. |
significance |
Significance symbol assigned using sig_levels. |
method |
Signal metric used for the estimate. |
compnc() also returns plot, the community identifier, and n_sp_in_plot, the number of taxa present in that community before trait specific missing values and phylogenetic matching are applied.
Coverage alone does not determine whether the retained data are adequate for a particular comparison. Interpret community estimates together with n_sp, n_sp_in_plot, and the pruned phylogeny, because similar coverage can retain different taxa and therefore different phylogenetic information. Signal is not estimated when fewer than four taxa have both trait and phylogenetic data; this is a computational safeguard rather than a universal sample size criterion.
Missing data assessment
The robustness functions return the observed lambda results together with the following simulation summaries.
| Column | Meaning |
|---|---|
simulation_lambda |
Lambda used to transform the reference phylogeny for simulation. It normally equals the observed estimate but is limited to the largest valid value for the reference phylogeny when necessary. |
consistency |
Percentage of successful paired simulations in which complete and incomplete data give the same significance classification at alpha_level. |
signal_bias |
Mean paired difference in lambda, calculated as lambda_missing - lambda_complete. Positive values indicate larger estimates after applying the missing data pattern, and negative values indicate smaller estimates. |
signal_sd |
Standard deviation of the paired lambda differences. |
n_successful |
Number of simulations in which both lambda estimates were obtained successfully. |
These metrics describe whether the observed missing data pattern tends to change the estimated signal or its significance classification under the simulation model.
Data preparation notes
merge_dataset()combines records computationally; users should confirm that trait definitions, units, transformations, and measurement protocols are biologically comparable before merging datasets.- By default,
extract_traits()reports an error when a species has multiple different finite values for the same trait. Usewithin_species = "mean"orwithin_species = "median"only when that summary rule is appropriate for the data. - When extracting genera or families,
extract_traits()first resolves repeated records within species and then aggregates the resulting species values. Each contributing species receives equal weight. The resulting value represents the central tendency of the contributing species, so the number of contributing species and variation among their trait values should be considered during interpretation. - Original traits are analyzed independently. Missing data in one trait do not remove a taxon from the analysis of another trait.
Citation
To obtain the recommended citation for PNC, run:
citation("PNC")
References
Blomberg, S. P., Garland, T., Jr and Ives, A. R. 2003. Testing for phylogenetic signal in comparative data: behavioral traits are more labile. -- Evolution 57: 717--745. doi:10.1111/j.0014-3820.2003.tb00285.x
Condit, R., Perez, R., Aguilar, S., Lao, S., Foster, R. and Hubbell, S. P. 2019. Complete data from the Barro Colorado 50-ha plot: 423617 trees, 35 years, 2019 version. -- Smithsonian Research Data Repository. doi:10.15146/5xcp-0d46
Ding, Z., Hu, H., Cadotte, M. W., Liang, J., Hu, Y. and Si, X. 2021. Elevational patterns of bird functional and phylogenetic structure in the central Himalaya. -- Ecography 44: 1403--1417. doi:10.1111/ecog.05660
Kattge, J., Bönisch, G., Díaz, S., Lavorel, S., Prentice, I. C., Leadley, P., Tautenhahn, S., Werner, G. D. A., Aakala, T., Abedi, M., Acosta, A. T. R., Adamidis, G. C., Adamson, K., Aiba, M., Albert, C. H., Alcántara, J. M., Alcázar C, C., Aleixo, I., Ali, H., Amiaud, B. et al. 2020. TRY plant trait database -- enhanced coverage and open access. -- Global Change Biol. 26: 43--60. doi:10.1111/gcb.14904
Münkemüller, T., Lavergne, S., Bzeznik, B., Dray, S., Jombart, T., Schiffers, K. and Thuiller, W. 2012. How to measure and test phylogenetic signal. -- Methods Ecol. Evol. 3: 743--756. doi:10.1111/j.2041-210X.2012.00196.x
Oliveira, B. F., São-Pedro, V. A., Santos-Barrera, G., Penone, C. and Costa, G. C. 2017. AmphiBIO, a global database for amphibian ecological traits. -- Sci. Data 4: 170123. doi:10.1038/sdata.2017.123
Oskyrko, O., Mi, C., Meiri, S. and Du, W. 2024. ReptTraits: a comprehensive dataset of ecological traits in reptiles. -- Sci. Data 11: 243. doi:10.1038/s41597-024-03079-5
Pagel, M. 1999. Inferring the historical patterns of biological evolution. -- Nature 401: 877--884. doi:10.1038/44766
Soria, C. D., Pacifici, M., Di Marco, M., Stephen, S. M. and Rondinini, C. 2021. COMBINE: a coalesced mammal database of intrinsic and extrinsic traits. -- Ecology 102: e03344. doi:10.1002/ecy.3344
Thorson, J. T., Maureaud, A. A., Frelat, R., Mérigot, B., Bigman, J. S., Friedman, S. T., Palomares, M. L. D., Pinsky, M. L., Price, S. A. and Wainwright, P. 2023. Identifying direct and indirect associations among traits by merging phylogenetic comparative methods and structural equation models. -- Methods Ecol. Evol. 14: 1243--1255. doi:10.1111/2041-210X.14076
Tobias, J. A., Sheard, C., Pigot, A. L., Devenish, A. J. M., Yang, J., Sayol, F., Neate-Clegg, M. H. C., Alioravainen, N., Weeks, T. L., Barber, R. A., Walkden, P. A., MacGregor, H. E. A., Jones, S. E. I., Vincent, C., Phillips, A. G., Marples, N. M., Montaño-Centellas, F. A., Leandro-Silva, V., Claramunt, S., Darski, B. et al. 2022. AVONET: morphological, ecological and geographical data for all birds. -- Ecol. Lett. 25: 581--597. doi:10.1111/ele.13898