MultiModalR
Fast Bayesian Probability Estimation for Multimodal Categorical Data
Fast Bayesian probability estimation for multimodal categorical data using speed-optimized Markov chain Monte Carlo (MCMC) implementation (Metropolis-Hastings-within-partial-Gibbs). The package provides efficient algorithms for detecting subpopulations, estimating mixture components, and assigning observations to subgroups with probability estimates. The methods are described in Dioszegi, G. et al. (2026) "Automatic Bayesian Mixture Modeling for Multimodal Categorical Data via Integrated Mode Detection and Metropolis-Hastings-within-Gibbs Sampling" (submitted to Journal of Statistical Software).
MultiModalR 🏔️ 📊 🔬



MultiModalR performs Bayesian mixture modeling for multimodal data. It detects subpopulations and assigns probabilistic memberships using two advanced Markov Chain Monte Carlo (MCMC) algorithms implemented in optimized C++:
-
Metropolis-Hastings within Gibbs Sampler for Gaussian Mixture Models - Fast and robust
-
Dirichlet-Multinomial (collapsed Gibbs) - Slower and rigorously robust
🎯 Features
- 🚀 Dual MCMC algorithms: Choose between Metropolis-Hastings (speed) or Dirichlet-Multinomial (robustness) depending on your data
- 🔍 Enhanced Mode Detection: Height-aware peak detection with four bandwidth methods
- 📊 Bayesian Probability Assignment: Soft assignment with probability estimates
- 🎪 Subpopulation Detection: Automatic detection of multimodal components
- ⚡ Parallel Processing: Built-in multi-core computation
- ✅ Validation Tools: Built-in plotting and validation functions
- 🔄 Flexible Input: Works with various data structures
- ⚙️ Optimized C++ Core: Blazing fast MCMC sampling with RcppArmadillo
📋 Prerequisites
R Package Dependencies
Rcpp, RcppArmadillo, dplyr, furrr, future
System Requirements
- R ≥ 4.0
- Multiple CPU cores for parallel processing
💾 Installation
# From CRAN (recommended)
install.packages("MultiModalR")

# Development version from GitHub
devtools::install_github("DijoG/MultiModalR")
🚀 Quick Start Example
library(MultiModalR)

# Load data
df <- MultiModalR::multimodal_dummy

# Run analysis with default settings
results <- fuss_PARALLEL_mcmc(
  data = df,
  varCLASS = "Category",
  varY = "Value",
  varID = "ID"
)

# View results summary
summary(results)
⚙️ Parameters
MultiModalR::fuss_PARALLEL_mcmc(
  data = df,                  # 📦 -> required
  varCLASS = "Category",      # 🏷️ -> required
  varY = "Value",             # 📈 -> required
  varID = "ID",               # 🆔 -> required
  method = "sj-dpi",          # 📏 /default
  within = 1,                 # 🎯 /default
  maxNGROUP = 5,              # 🔢 /default
  out_dir = ".../output",     # 💾 -> optional
  n_workers = 3,              # ⚡ /default
  n_iter = NULL,              # 🔄 /default
  burnin = NULL,              # 🔥 /default
  proposal_sd = 0.15,         # 📊 /default
  sj_adjust = 0.5,            # ⚖️ /default
  mcmc_method = "metropolis", # 🧮 /default
  dirichlet_alpha = 2.0       # 🎲 /default
)
📚 Detailed Example
Data
library(MultiModalR)

# Load the built-in dataset
df <- MultiModalR::multimodal_dummy

# View the data structure
head(df)
str(df)
Data Visualization
library(ggplot2)

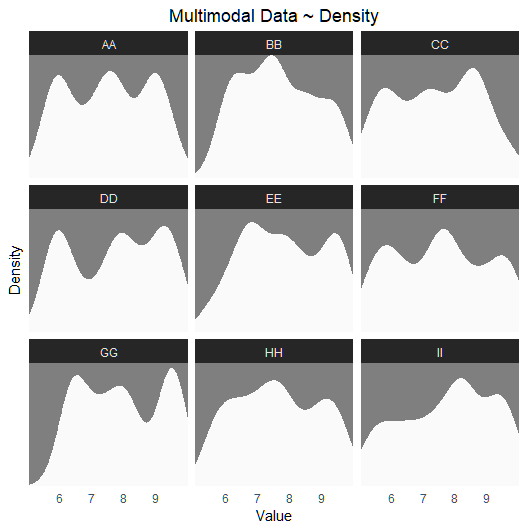
# Plot 01 ~ subpopulations/subgroups not shown
ggplot(df, aes(x = Value)) +
  geom_density(color = NA, fill = "grey98", adjust = .8) +
  facet_wrap(~Category) +
  theme_dark() +
  labs(title = "Multimodal Data ~ Density",
       x = "Value", y = "Density") +
  scale_y_continuous(expand = expansion(mult = c(0, 0))) +
  scale_x_continuous(expand = expansion(mult = c(0, 0))) +
  theme(legend.position = "top",
        axis.text.y = element_blank(),
        axis.ticks = element_blank(),
        panel.grid.major = element_blank(), panel.grid.minor = element_blank(),
        plot.title = element_text(hjust = .5))
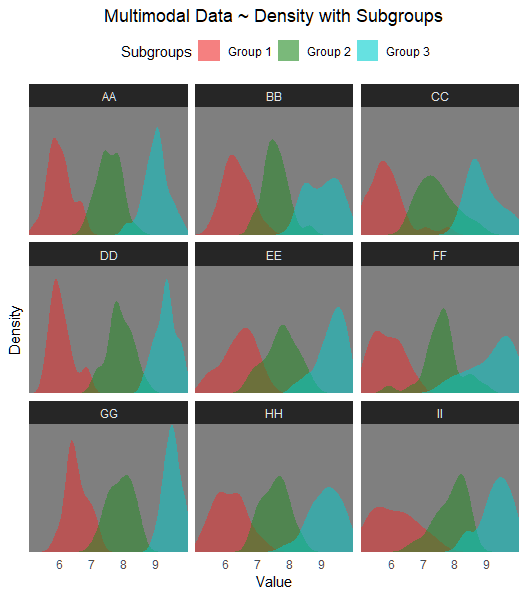
# Plot 02 ~ subgroups shown
ggplot(df, aes(x = Value, fill = Subpopulation)) +
  geom_density(alpha = 0.5, color = NA) +
  scale_fill_manual(values = c("firebrick2", "forestgreen", "cyan3"),
                     name = "Subgroups") +
  facet_wrap(~Category) +
  theme_dark() +
  labs(title = "Multimodal Data ~ Density with Subgroups",
       x = "Value", y = "Density") +
  scale_y_continuous(expand = expansion(mult = c(0, 0))) +
  scale_x_continuous(expand = expansion(mult = c(0, 0))) +
  theme(legend.position = "top",
        legend.key = element_rect(fill = "transparent", color = NA),
        axis.text.y = element_blank(),
        axis.ticks = element_blank(),
        panel.grid.major = element_blank(), panel.grid.minor = element_blank(),
        plot.title = element_text(hjust = .5)) +
  guides(fill = guide_legend(override.aes = list(alpha = .6)))
Parallel Processing Setup
# Configure parallel processing
cores <- 3
Running Analysis
# Dirichlet MCMC
MultiModalR::fuss_PARALLEL_mcmc(
  data = df,
  varCLASS = "Category",
  varY = "Value",
  varID = "ID",
  out_dir = "D:/MultiModalR/test",
  n_workers = cores,
  mcmc_method = "dirichlet"
)
tictoc::toc()
# Processing time: 5.19 sec (3 cores) ~ 91.4% overall accuracy

# -- OR (recommended default) -->

# Metropolis-Hastings within Gibbs Sampler for Gaussian Mixture Models
MultiModalR::fuss_PARALLEL_mcmc(
  data = df,
  varCLASS = "Category",
  varY = "Value",
  varID = "ID",
  out_dir = "D:/MultiModalR/test",
  n_workers = cores
)
tictoc::toc()
# Processing time: 3.18 sec (3 cores) ~ 92% overall accuracy
Output
The function generates:
- Data CSV files: Original data with assigned subgroups and probabilities
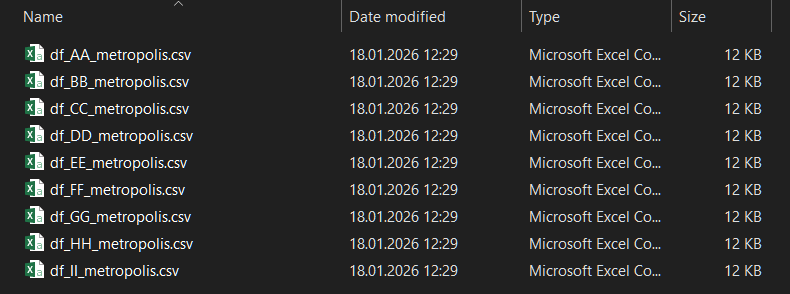
A Data CSV file consists of the following fields (maxNGROUP = 5):
y: Original/observed valueGroup: Original/observed subgroupGroup_1: Predicted belonging probability toGroup_2: Predicted belonging probability toGroup_3: Predicted belonging probability toGroup_4: Predicted belonging probability toGroup_5: Predicted belonging probability toAssigned_Group: Assigned/predicted subgroupMin_Assigned: Minimum value of the assigned/predicted rangeMax_Assigned: Maximum value of the assigned/predicted rangeMean_Assigned: Mean value of the assigned/predicted rangeMode_Assigned: Mode of the assigned/predicted rangeMain_Class: Category/main group/class
Validation Visualization
# Validate subgroup assignments
MultiModalR::plot_VALIDATION(
  "D:/MultiModalR/test",
  df,
  subpop_col = "Subpopulation",
  value_col = "Value",
  id_col = "ID")
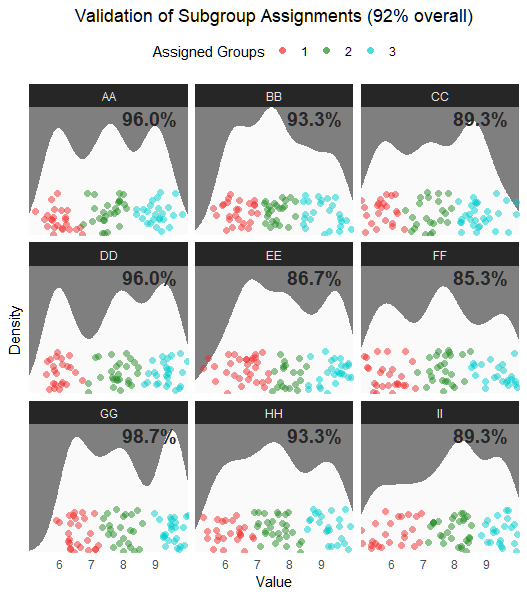
Validation results show accurate subgroup assignments across categories.
Generate Custom Data
You can also generate custom multimodal data with different parameters:
# Generate custom dataset
custom_data <- MultiModalR::create_multimodal_dummy(
  seed = 12,
  n_categories = 6,
  n_per_group = 30,
  n_subgroups = 4
)
Happy multimoda(e)ling! 🏔️️ 📊 🎯
📝 Citation
If you use MultiModalR in your research, please cite the original paper: after publication