HeatmapR
Create Heatmaps Using Base Graphics
Provides a lightweight framework for creating high quality, complex
heatmaps using base graphics. Supports hierarchical clustering with
dendrograms, column and row scaling, cluster sub-divisions, customizable
cell colours, shapes and sizes, legends, and flexible layouts for arranging
multiple heatmaps. Designed to return plot objects that can be easily
arranged with other plots without sacrificing resolution. Methods for
hierarchical clustering and distance computations are described in
Murtagh and Contreras (2012)
HeatmapR 




HeatmapR it a lightweight R package that makes it easy to generate high quality, complex heatmaps with minimal data preprocessing or manual customization. Visit the HeatmapR website to get started https://dillonhammill.github.io/HeatmapR/.
Overview
As the dimensionality of datasets continues to increase there is a need
for visualisation tools such as heatmaps to present data in an easily
interpretable way. The construction of complex heatmaps poses a number
of challenges as they are composed multiple graphical elements, such as
a coloured matrix, dendrograms, cluster sub-divisions, axes, titles and
legends. The first base graphics implementation of heatmaps included
heatmap() in the stats package and heatmap.2() in the
gplots. The packages
attempt to solve these graphical challenges by treating each graphical
component as a separate plot element and arranging them using
layout(). This approach can generate complex heatmaps but it rendered
users unable to arrange the heatmap with additional plot elements.
HeatmapR aims to address these layout issues using solely a base
graphics approach.
HeatmapR
HeatmapR has a number of benefits over other heatmap packages:
- HeatmapR is built using base graphics to remove the need for
familiarity with
ggplot2orplotly. - HeatmapR is extremely lighweight and therefore there are no external dependencies that need to be installed.
- HeatmapR is designed under ROpenSci naming guidelines for a consistent and intuitive user experience.
- Unlike other heatmap packages that use base graphics, HeatmapR actually returns the plot object instead of an image. This makes it easy to arrange multiple plots in complex layouts without sacrificing resolution.
- HeatmapR is fully customizable and comes with useful saving API
(
heat_map_save()) to export high resolution images. - HeatmapR handles datasets that contain non-numeric or missing data, which means you don’t have to spend ages formatting and pre-processing the data beforehand.
- HeatmapR generates publication ready images with minimal manual customization, making it ideal for users that have limited coding experience.
Installation
HeatmapR can be installed directly from GitHub:
devtools::install_github("DillonHammill/HeatmapR")
Usage
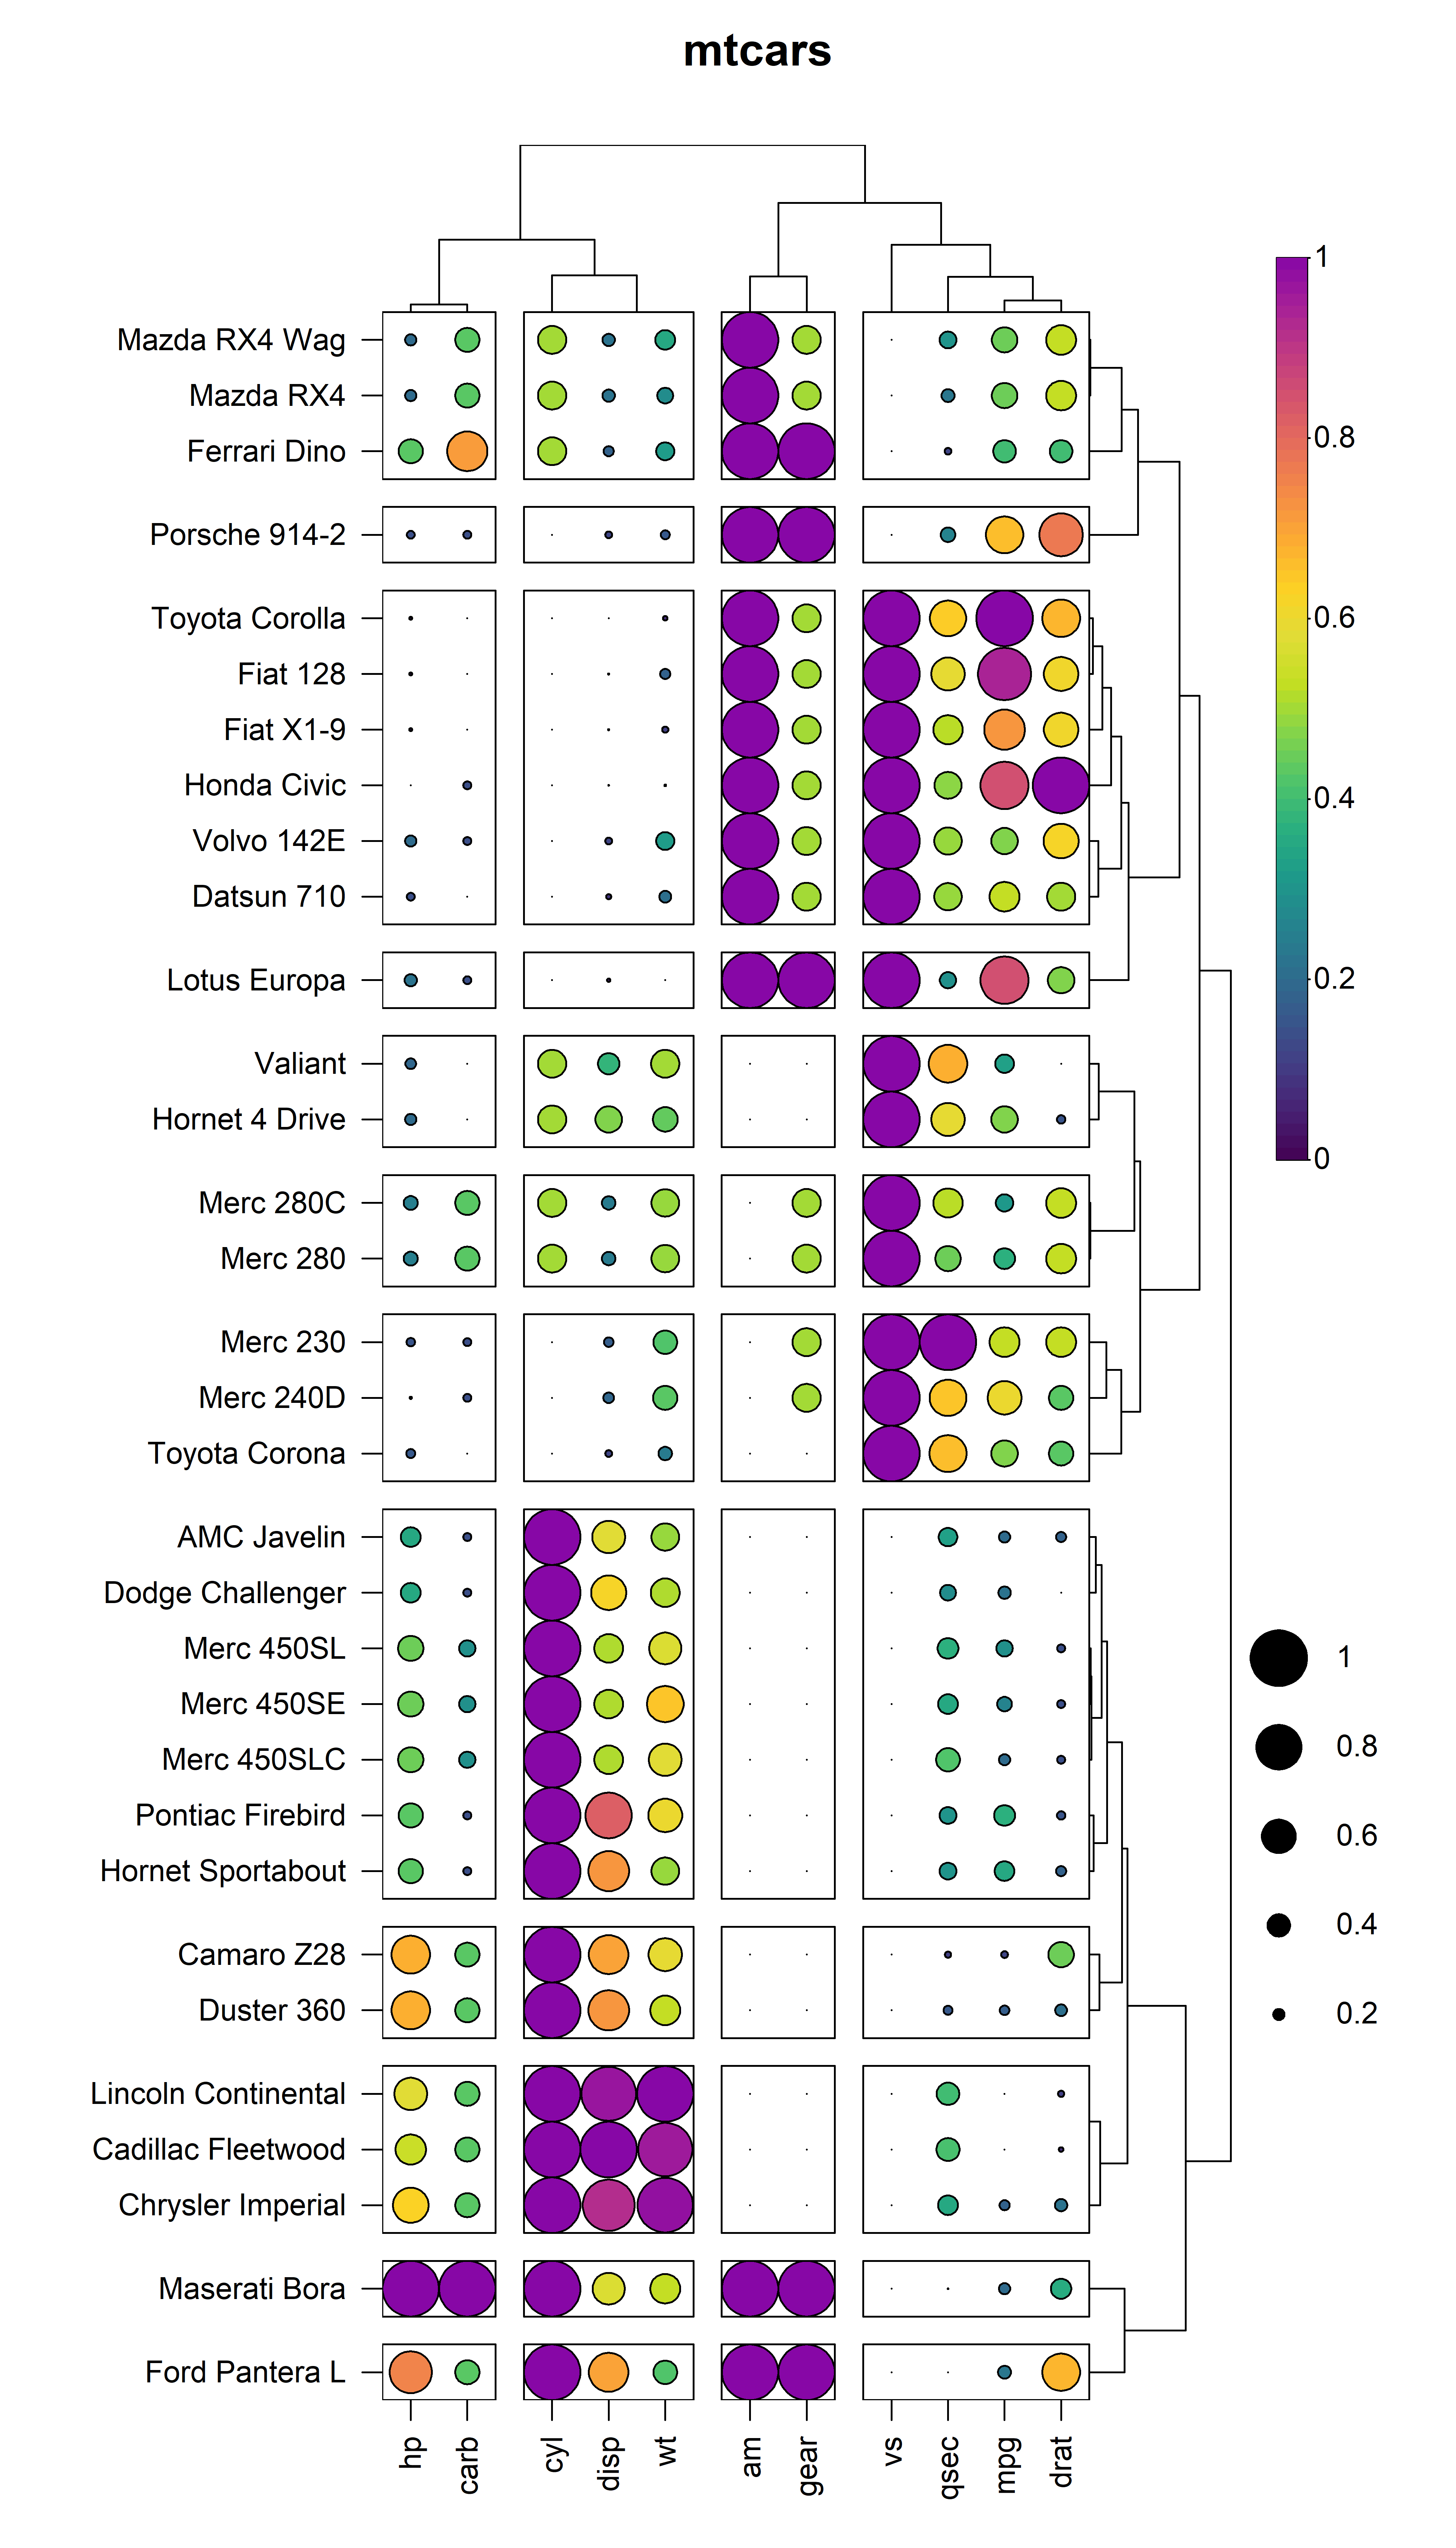
Creating heatmaps is as easy as loading HeatmapR and supplying your
dataset to the heat_map() function. For details on customising your
heatmaps, refer to the package vignette.
library(HeatmapR)
heat_map(
  mtcars,
  scale = "column",
  scale_method = "range",
  tree_x = TRUE,
  tree_y = TRUE,
  tree_cut_x = 4,
  tree_cut_y = 12,
  cell_size = TRUE,
  cell_shape = "circle",
  title = "mtcars"
)
Acknowledgements
HeatmapR relies on statistical methods in the stats package to
compute distance matrices and perform hierarchical clustering.
HeatmapR also uses some modified stats code from the
ggdendro package to get the
co-ordinates for the dendrogram line segments.
Code of Conduct
Please note that the HeatmapR project is released with a Contributor Code of Conduct. By contributing to this project, you agree to abide by its terms.
Citation
If you use HeatmapR for your work please cite the package as follows:
citation("HeatmapR")
#> To cite package 'HeatmapR' in publications use:
#>
#>   Hammill D (2026). _HeatmapR: Create Heatmaps Using Base Graphics_. R
#>   package version 1.1.0, <https://dillonhammill.github.io/HeatmapR/>.
#>
#> A BibTeX entry for LaTeX users is
#>
#>   @Manual{,
#>     title = {HeatmapR: Create Heatmaps Using Base Graphics},
#>     author = {Dillon Hammill},
#>     year = {2026},
#>     note = {R package version 1.1.0},
#>     url = {https://dillonhammill.github.io/HeatmapR/},
#>   }