ColorNameR
Give Colors a Name
A tool for transforming coordinates in a color space to common color names using data from the Royal Horticultural Society and the International Union for the Protection of New Varieties of Plants.
ColorNameR

While coordinates in a space such as RGB or CIELab are useful to represent colors, a descriptive name is sometimes more appropriate to distinguish them in a qualitative way. For instance, it is commonplace to discriminate the colors of plants, flowers, and fruits using color charts provided by institutions like the Royal Horticultural Society (RHS), which provide a finite number of categories to where colors can be fit. Although these categories do not have a meaningful name, the Union for the Protection of New Varieties of Plants (UPOV) presents a glossary where each of them are translated to a more natural name.
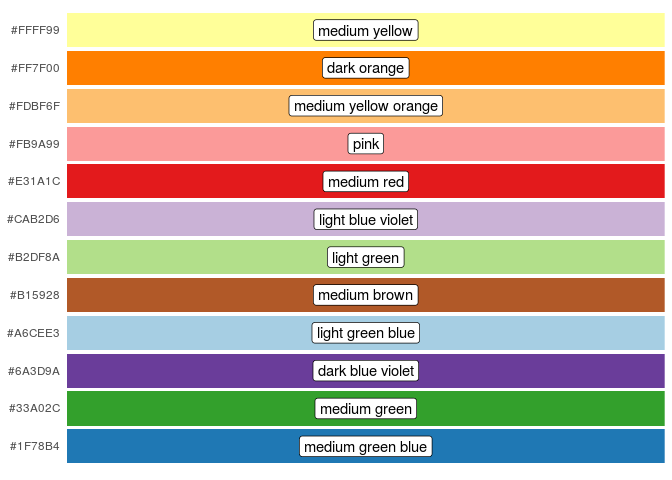
ColorNameR is a small library designed to give names to colors, which is accomplished by looking up their closest equivalent category in the RHS and then translating its code to natural language with the UPOV glossary. It provides the following:
-
?name, a function that returns the name of a color given its coordinates in a color space. -
?colordiff, an implementation of the CIE76, CIE94, and CIEDE2000 color distances, used to find the closest color to some reference CIELab coordinates. -
?rhs_color_values_2007, a data set that contains approximate color coordinates for the categories defined by the RHS color chart in its fifth edition (2007). -
?rhs_color_names_2015, a data set that contains names given by the UPOV for each RHS category in the chart’s sixth edition (2015).
Installation
You can install the development version of ColorNameR from GitHub with:
# install.packages("devtools")
devtools::install_github("msanchez-beeckman/ColorNameR")
Example
library(ColorNameR)
library(tibble)
library(ggplot2)
library(RColorBrewer)

palette_colors <- brewer.pal(12, "Paired")
names(palette_colors) <- palette_colors

tibble(color=palette_colors, value=1L) %>%
  dplyr::mutate(name=name(t(col2rgb(.data[["color"]])) / 255, colorspace="sRGB")) %>%
  ggplot(aes(x=color, y=value)) +
    geom_col(aes(fill=color)) +
    geom_label(aes(label=name), position=position_stack(vjust = 0.5)) +
    scale_fill_manual(values=palette_colors) +
    scale_y_continuous(limits = c(0, 1), expand = c(0, 0)) +
    coord_flip() +
    theme(legend.position="none",
          axis.title=element_blank(), axis.ticks=element_blank(),
          axis.text.x=element_blank(), panel.background=element_blank())