wheatmap
Incrementally Build Complex Plots using Natural Semantics
Builds complex plots, heatmaps in particular, using natural semantics. Bigger plots can be assembled using directives such as 'LeftOf', 'RightOf', 'TopOf', and 'Beneath' and more. Other features include clustering, dendrograms and integration with 'ggplot2' generated grid objects. This package is particularly designed for bioinformaticians to assemble complex plots for publication.
wheatmap


wheatmap builds complex heatmap figures by composing panels using plain-English placement directives: TopOf, RightOf, Beneath, LeftOf, and variants. Each panel is a named object; subsequent panels reference earlier ones by name to anchor their position. The result is a single +-chained expression that reads like a description of the layout.
Installation
From CRAN:
install.packages("wheatmap")
From GitHub (development version):
# install.packages("devtools")
devtools::install_github("zwdzwd/wheatmap")
Design
A wheatmap figure is built by chaining objects with +. The first object anchors the coordinate system at full canvas extent. Every subsequent object receives a placement generator — RightOf("name"), Beneath("name"), etc. — that resolves its position relative to a named predecessor at draw time.
Core object types:
| Constructor | Purpose |
|---|---|
WHeatmap() |
Heatmap body (continuous or discrete color mapping) |
WColorBarH() / WColorBarV() |
Horizontal / vertical annotation bar |
WLegendV() |
Vertical color legend keyed to a named heatmap |
WCustomize() |
Global figure settings (margins, background, etc.) |
Color mapping is controlled by CMPar(), which wraps palettes from RColorBrewer, colorspace, and the built-in jet/bwr maps.
Each object can be given a name= for cross-referencing. If omitted, wheatmap assigns one automatically; ly() shows all current names.
Basic usage
library(wheatmap)

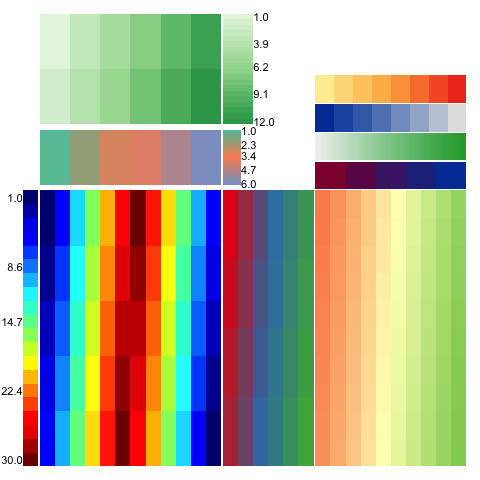
WHeatmap(matrix(1:12, nrow=2), cmp=CMPar(brewer.name='Greens'), name='a') +
  WHeatmap(matrix(1:6,  nrow=1), Beneath(pad=0.05), cmp=CMPar(brewer.name='Set2'), name='b') +
  WHeatmap(matrix(c(1:30,30:1), nrow=5), Beneath(pad=0.05), name='c', cmp=CMPar(cmap='jet')) +
  WHeatmap(matrix(1:24, nrow=4), RightOf('c'), name='d', cmp=CMPar(brewer.name='Set1')) +
  WLegendV('c', LeftOf('c',  pad=0.01), yticklabel.side='l') +
  WLegendV('b', RightOf('b', width=0.1)) +
  WLegendV('a', RightOf('a')) +
  WHeatmap(matrix(1:100, nrow=10), RightOf('d'), cmp=CMPar(brewer.name='RdYlGn')) +
  WColorBarH(matrix(5:1), TopOf(), cmp=CMPar(colorspace.name='diverge_hcl')) +
  WColorBarH(matrix(50:1), TopOf(), cmp=CMPar(colorspace.name='terrain_hcl')) +
  WColorBarH(matrix(1:8),  TopOf(), cmp=CMPar(colorspace.name='sequential_hcl')) +
  WColorBarH(matrix(1:8),  TopOf(), cmp=CMPar(brewer.name='YlOrRd'))
magrittr users can pipe with %>% and add() instead of +:
library(magrittr)
WHeatmap(m, name='h1') %>% add(WColorBarV(row.data, LeftOf('h1'), name='c1'))
Auto-margin layout
print(g) wraps the figure in a gtable so that outward-facing tick labels, colorbar labels, and legends are measured at draw time and reserved as page margins rather than clipping at the device edge. WCustomize(mar.*) values act as a minimum floor; the measured extent wins when it is larger.
m <- matrix(rnorm(200), nrow=20)
rownames(m) <- sprintf("very_long_row_label_%02d", 1:20)
grp <- rep(c("groupA","groupB","groupC","groupD"), each=5)

g <- WHeatmap(m, name="main",
              yticklabels=TRUE, yticklabel.side='r', yticklabel.fontsize=7) +
     WColorBarH(grp, TopOf("main"), name="grp",
                label.use.data=TRUE, label.fontsize=8) +
     WCustomize()

pdf("output.pdf", width=5, height=5)
print(g)
dev.off()
Siblings placed via RightOf / LeftOf / TopOf / Beneath are automatically shifted outward by the measured label extent of their predecessor, so a legend next to a labeled colorbar clears the labels rather than overlapping them.
References
Acknowledgement
The internal grid.dendrogram() function is adapted from the ComplexHeatmap package.