ufRisk
Risk Measure Calculation in Financial TS
Enables the user to calculate Value at Risk (VaR) and Expected Shortfall (ES) by means of various parametric and semiparametric GARCH-type models. For the latter the estimation of the nonparametric scale function is carried out by means of a data-driven smoothing approach. Model quality, in terms of forecasting VaR and ES, can be assessed by means of various backtesting methods such as the traffic light test for VaR and a newly developed traffic light test for ES. The approaches implemented in this package are described in e.g. Feng Y., Beran J., Letmathe S. and Ghosh S. (2020) < https://ideas.repec.org/p/pdn/ciepap/137.html> as well as Letmathe S., Feng Y. and Uhde A. (2021) < https://ideas.repec.org/p/pdn/ciepap/141.html>.
ufRisk

The goal of ufRisk is to enable the user to compute one-step ahead
forecasts of Value at Risk (VaR) and Expected Shortfall (ES) by means of
various parametric and semiparametric GARCH-type models. For the latter
the estimation of the nonparametric scale function is carried out by
means of a data-driven smoothing approach. Currently the GARCH, the
exponential GARCH (EGARCH), the Log-GARCH, the asymmetric power ARCH
(APARCH), the FIGARCH and FI-Log-GARCH can be employed within the scope
of ufRisk. Model quality, in terms of forecasting VaR and ES, can be
assessed by means of various backtesting methods.
Installation
You can install the released version of ufRisk from CRAN with:
install.packages("ufRisk")
Example
The data set ESTX, which is implemented in the ufRisk package,
contains daily financial data of the EURO STOXX 50 (ESTX) index from
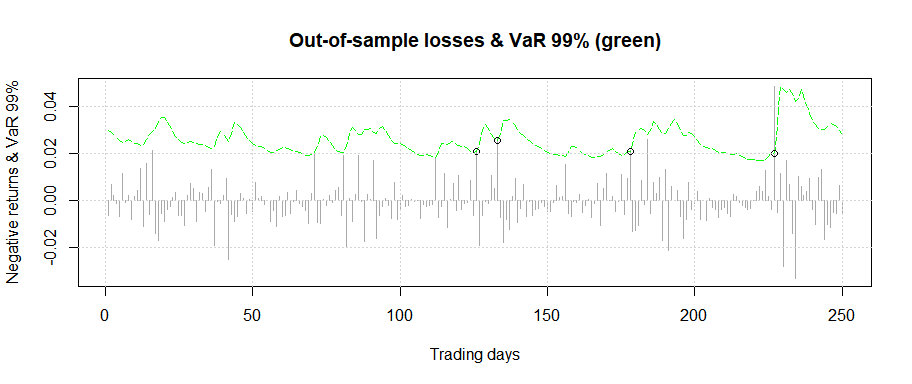
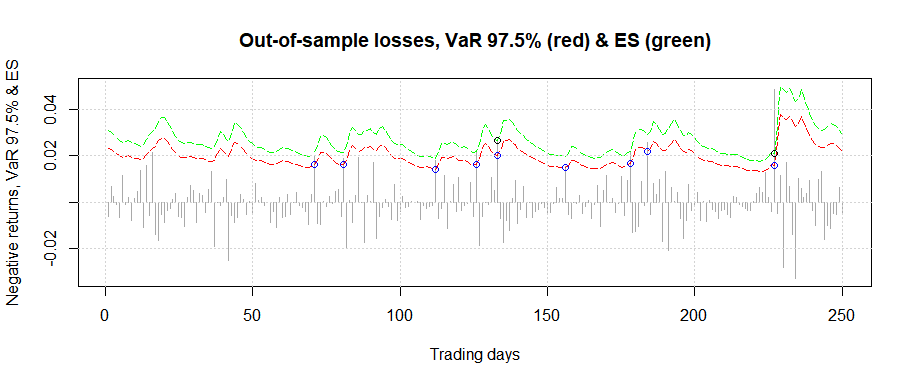
April 2007 to December 2021. In the following an example of the
(out-of-sample) one-step forecasts of the
97.5-VaR
(red line) and the corresponding ES (green line) as well as the
99
-VaR
(green line), which are obtained by employing a FIGARCH model to the
ESTX return series, are illustrated. Exceedances are indicated by the
colored circles.
# Applying the FIGARCH model to the ESTX return series
x = ESTX$price.close
results = varcast(x, model = 'fiGARCH', a.v = 0.99, a.e = 0.975, n.out = 250)
Visualize your results by means of the implemented plot method
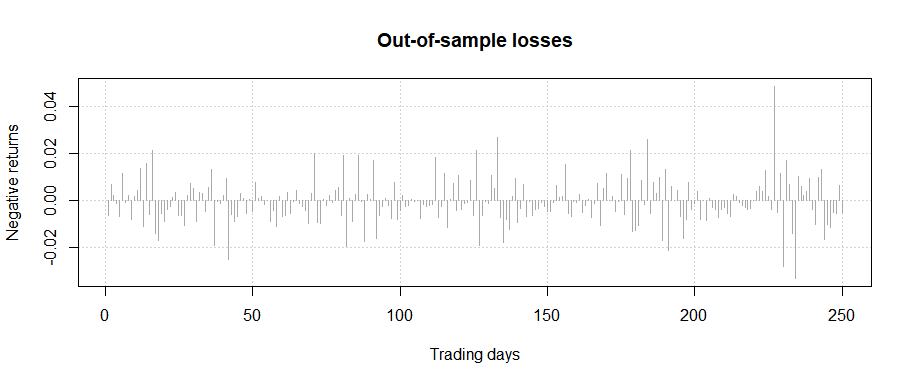
Plotting the out-of-sample loss series:
plot(results, plot.option = 1)
Plotting the out-of-sample loss series, VaR.v & breaches:
plot(results, plot.option = 2)
Plotting the out-of-sample loss series, VaR.e, ES & breaches:
plot(results, plot.option = 3)
Assess the quality of your model by employing various backtesting
methods by means of the functions trafftest, covtest and lossfunc.
Conduct a traffic light test for VaR and ES
trafftest(results)
#>
#> ###################################
#> #       Backtesting results       #
#> ###################################
#>
#> # Traffic light zone boundaries #
#>  Zone         Probability
#>  Green zone:  p < 95%
#>  Yellow zone: 95% <= p < 99.99%
#>  Red zone:    p >= 99.99%
#>
#> # Test 1: 99%-VaR #
#>  Number of violations: 4
#>  p = 0.8922: Green zone
#>
#> # Test 2: 97.5%-VaR #
#>  Number of violations: 9
#>  p = 0.9005: Green zone
#>
#> # Test 3: 97.5%-ES #
#>  Number of weighted violations: 5.1227
#>  p = 0.9188: Green zone
#>
#> # Weighted Absolute Deviation #
#>  WAD = 1.6793
Conduct a conditional and unconditional coverage test as well as an independence test
covtest(results, conflvl = 0.95)
#>
#> ##################################
#> #          Test results          #
#> ##################################
#>
#> # Unconditional coverage test #
#>
#> H0: w = 0.99
#> p_[uc] = 0.3805
#> Decision: Fail to reject H0
#>
#> # Independence test #
#>
#> H0: w_[00] = w_[10]
#> p_[ind] = 0.6865
#> Decision: Fail to reject H0
#>
#> # Conditional coverage test #
#>
#> H0: w_[00] = w_[10] = 0.99
#> p_[cc] = 0.6275
#> Decision: Fail to reject H0
#>
Calculate different loss functions
lossfunc(results)
#> Please note that the following results are multiplied with 10000.
#>
#> $lossfunc1
#> [1] 7.693316
#>
#> $lossfunc2
#> [1] 14.31244
#>
#> $lossfunc3
#> [1] 14.56085
#>
#> $lossfunc4
#> [1] 13.61529
Functions
In ufRisk four functions are available.
Original functions since version 1.0.0:
covtest: Coverage testslossfunc: Calculation of loss functionstrafftest: Traffic light tests for VaR and ESvarcast: One-step ahead forecasting of VaR and ES
For further information on each of the functions, we refer the user to the manual or the package documentation.
Data Sets
ESTX: Daily financial time series data of the EURO STOXX 50 Index (ESTX) from April 2007 to December 2021WMT: Daily financial time series data of Walmart Inc. (WMT) from January 2000 to December 2021