pdokr
Access Open Geodata from the Dutch 'PDOK' Platform
Tools to discover, download, and spatially filter open geographic data from 'PDOK' (Publieke Dienstverlening Op de Kaart), the national geodata platform of the Netherlands. Datasets and their layers are searched and loaded as vector simple feature ('sf') objects through 'OGC' API Features endpoints, with automatic pagination and explicit coordinate reference system handling. Loaded layers can be filtered by any polygon area, and addresses or place names can be geocoded through the 'PDOK' location server. The focus is on vector feature data; raster, tile, and coverage services are out of scope. See < https://www.pdok.nl/> for more information about the platform and its services.
pdokr 


pdokr makes it easy to work with open geographic data from
PDOK (Publieke Dienstverlening Op de Kaart), the
national geodata platform of the Netherlands. It helps you discover
datasets and their layers, load a layer as an
sf object (with automatic
pagination and explicit coordinate reference system handling), filter
data by any polygon area, and geocode addresses and place names.
pdokr is a client for PDOK’s OGC API Features services: it reads
vector feature data (points, lines, polygons) as sf. Raster, tile,
and coverage services are out of scope. For the official PDOK map
background, use pdok_basemap().
Installation
pdokr is not yet on CRAN. Install the development version from
GitHub:
# install.packages("remotes")
remotes::install_github("coeneisma/pdokr@develop")
Example
Pick an area from the administrative boundaries, then load another layer within it. Here we take the historic center of Delft and map every building in it.
library(pdokr)
library(tmap)

# A municipality, and one of its districts (the historic center of Delft)
gemeenten <- pdok_read(
  "cbs/gebiedsindelingen", "gemeente_gegeneraliseerd", datetime = 2024
)
delft <- gemeenten[gemeenten$statnaam == "Delft", ]

wijken <- pdok_read(
  "cbs/gebiedsindelingen", "wijk_gegeneraliseerd", datetime = 2024,
  filter_by = delft, predicate = "within"
)
binnenstad <- wijken[wijken$statnaam == "Wijk 11 Binnenstad", ]

# Every building in that district, from the TOP10NL topography
buildings <- pdok_read("brt/top10nl", "gebouw_vlak", filter_by = binnenstad)

# Map it
tmap_mode("plot")
tm_basemap(pdok_basemap("grijs")) +
  tm_shape(binnenstad) +
  tm_borders(col = "grey40") +
  tm_shape(buildings) +
  tm_polygons(fill = "#d95f02", col = "white", lwd = 0.4) +
  tm_title("Buildings in the historic center of Delft") +
  tm_credits("Kaartgegevens © Kadaster")
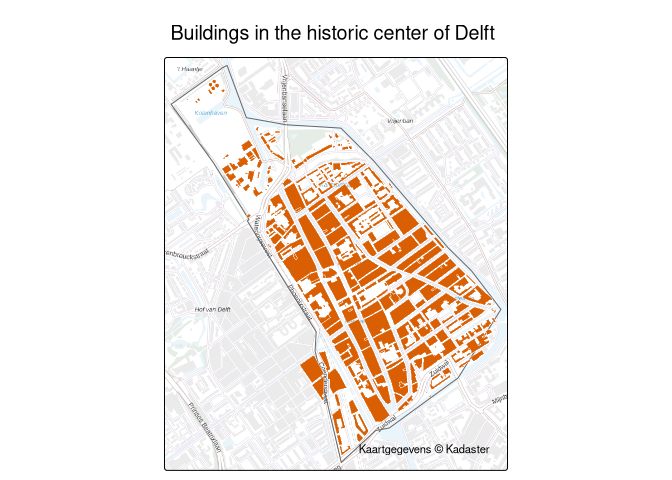
The articles on the package website walk through this and other workflows, with interactive, zoomable maps.
Learn more
See the package website for the reference documentation and articles on getting started, filtering data by area, working with coordinate reference systems, and querying PDOK by hand.