icecdr
Download Sea Ice Concentration Data from the NSIDC Climate Data Record
Programmatic access to NSIDC's sea ice concentration CDR < https://nsidc.org/data/g02202> via ERDAPP server and Sea Ice index < https://nsidc.org/data/g02135>. Supports caching results and optional fixes for some inconsistencies of the raw files.
icecdr


The goal of icecdr is to download sea ice concentration data from the NSIDC Climate Data Record.
Installation
You can install the icecdr with:
install.packages("icecdr")
Example
Use the cdr_* functions to download satellite-derived Antarctic or
Arctic sea ice concentration data at monthly or daily resolution. They
use version 5 by default but version 4 is also supported.
The basic usage downloads a NetCDF file in a temporary directory.
library(icecdr)

dates <- c("2020-01-01", "2023-01-01")
cdr_antarctic_monthly(dates, dir = "data")
#> Downloading data.
#> [1] "data/05c77e3b938053bdbed2137c61dc6052.nc"
By default, files are only downloaded if needed.
system.time(cdr_antarctic_monthly(dates, dir = "data"))
#> Returning existing file.
#>    user  system elapsed
#>   0.019   0.000   0.020
There are four simple functions to download whole-domain data:
cdr_antarctic_daily()
cdr_antarctic_monthly()

cdr_arctic_daily()
cdr_arctic_monthly()
But the cdr() function exposes all arguments to download any crazy
subset
cdr(date_range = dates,
    # Data every 7 days
    date_stride = 7,
    resolution = "daily",
    # Thin the grid by taking every other gridpoint
    xgrid_stride = 2,
    ygrid_stride = 2,
    hemisphere = "north"
    )
The cdr_fix() function will fix the grid information to make it work
with CDO and standardise
variable names. This requires CDO installed in your system.
library(rcdo)
library(ggplot2)

extent_cdr <- cdr_antarctic_monthly(dates, dir = "data") |>
  cdr_fix() |>
  cdo_gtc(0.15) |>
  cdo_fldint() |>
  cdo_execute() |>
  metR::ReadNetCDF(c(extent = "aice"))
#> Warning: Using CDO version 2.4.0 which is different from the version supported by this
#> version of rcdo (2.5.1).
#> ℹ This warning is displayed once per session.
#> Returning existing file.

extent_index <- sea_ice_index("south", "monthly", dir = "data") |>
  data.table::fread() |>
  subset(time >= dates[1] & time <= dates[2])
#> Downloading data.

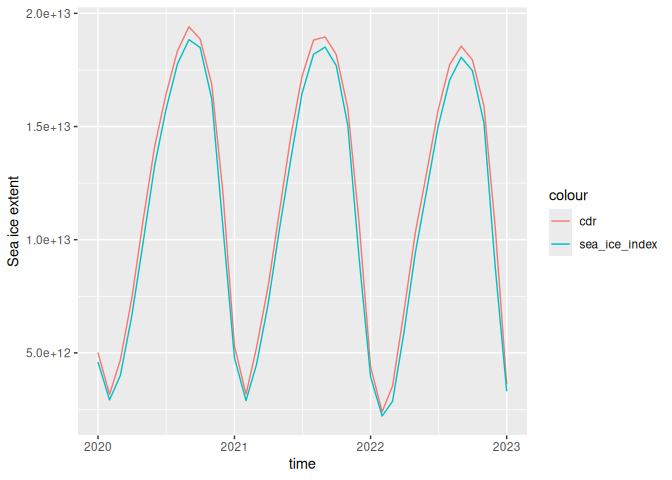
extent_cdr |>
  ggplot(aes(time, extent)) +
  geom_line(aes(colour = "cdr")) +
  geom_line(data = extent_index, aes(colour = "sea_ice_index")) +
  labs(y = "Sea ice extent")